
Upzoning: Predictions versus reality in California
An outsider looks at California's planning law changes

If you missed last week’s article on dual-income families, check it out here.
In 2021 California passed a law (SB9) to allow multiple dwellings on parcels zoned for single-dwelling units.1
From the outside, it seems to allow things that Australians would call granny flats or dual occupancy, but it goes further to include things like battle-axe blocks, splitter blocks, and other variations of small subdivisions.
Some people thought the new law was pretty revolutionary.

Others thought it was modest. A restrained early Terner Center analysis of the housing supply consequences of this change was as follows.
Our analysis shows that approximately 700,000 new, market-feasible homes would be enabled under SB 9. But despite the concerns of some of its detractors, SB 9 will not lead to the overnight trans-formation of residential neighborhoods. Differential owner preferences and limited applicability means that only a share of that potential is likely to be developed, particularly in the near term as aware- ness and capacity expands. As such, while important, the new units unlocked by SB 9 would represent a fraction of the overall supply needed to fully address the state’s housing shortage.
The report seems torn between optimistic and realistic. They optimistically knew that the bill would make many more homes financially feasible. But realistically, they couldn’t imagine that all feasible homes would get built (hint: the reason is that feasibility and new housing production are not the same thing).
The table below shows their estimate in more detail. There are an estimated 700,000 extra feasible homes on 410,000 lots.
This seems like a huge win to me.

One year later…
The Terner Center revisited their predictions in June 2022, six months after the law was passed, and after seeing how local governments had implemented the state-level changes. They further hedged their predictions.
Then, a year after implementation, they looked at how many new housing lots were generated by SB9 in a selection of areas.
Here’s their finding with my emphasis.
We found that SB 9 activity is limited or non-existent in these thirteen cities (Table 1). Los Angeles had the most overall activity, with 211 applications for new units under SB 9 in 2022. The state’s other large cities all reported very few applications for lot splits or new units. For example, the city of San Diego reported receiving just seven applications for new SB 9 units in 2022. To put these numbers into context, the city of San Diego permitted over 5,000 new homes in all of 2021 and Los Angeles permitted just under 20,000 new homes in 2021.
Here’s their table with the first 11 months of applications and approvals.

It’s hard to say that this is a revolutionary outcome. A few hundred applications, and 50-something approved.
There appear to be more YouTube videos about the housing benefits of SB9 than there are SB9 dwellings.
In a state with 15 million dwellings, the price effect of an extra couple of hundred homes is immeasurably small. And this is the best case. If these homes are substitutes for other new housing, the effect is even lower and could be zero.
Sure, upzone if you think density is a more efficient way to grow than city expansion. I think that is often the case. But don’t think you have found a magic bullet for cheap housing.
Legislate harder?
Last year we got a report looking at all the planning and zoning reforms in California. There are many happening, but little change in the overall situation.
SB35, which “allows eligible proposed housing developments to go through a ministerial (aka “by-right”) rather than discretionary entitlement process” appears to be more consequential. After four years, 161 projects were proposed under this provision, comprising over 18,000 dwellings. How many of these will ever be built and the net effect of the change is hard to tell. These aren’t all extra dwellings. Because this measure is temporary, there is an incentive for developers to bring forward approvals using this process while it exists, but not change their overall sequence of construction.
Overall, despite years of effort, new housing development isn’t taking off in California. The Senate Housing Committee met to discuss in February 2023 why so much legislative change has not led to an immediate and rapid increase in housing development. Some are now asking this question on social media.

Others are questioning the whole business of housing targets, something that Australian governments seem keen to replicate.
All this type of thinking is predicated on the idea that property owners want to invest in new home-building faster than they are. In this simplified view of the world, there is no room for property owners themselves to optimise and time their investment decisions.
In the chart below we can see how closely housing production tracks macroeconomic cycles. New housing more than doubled from the early 2010s trough by the end of the decade.
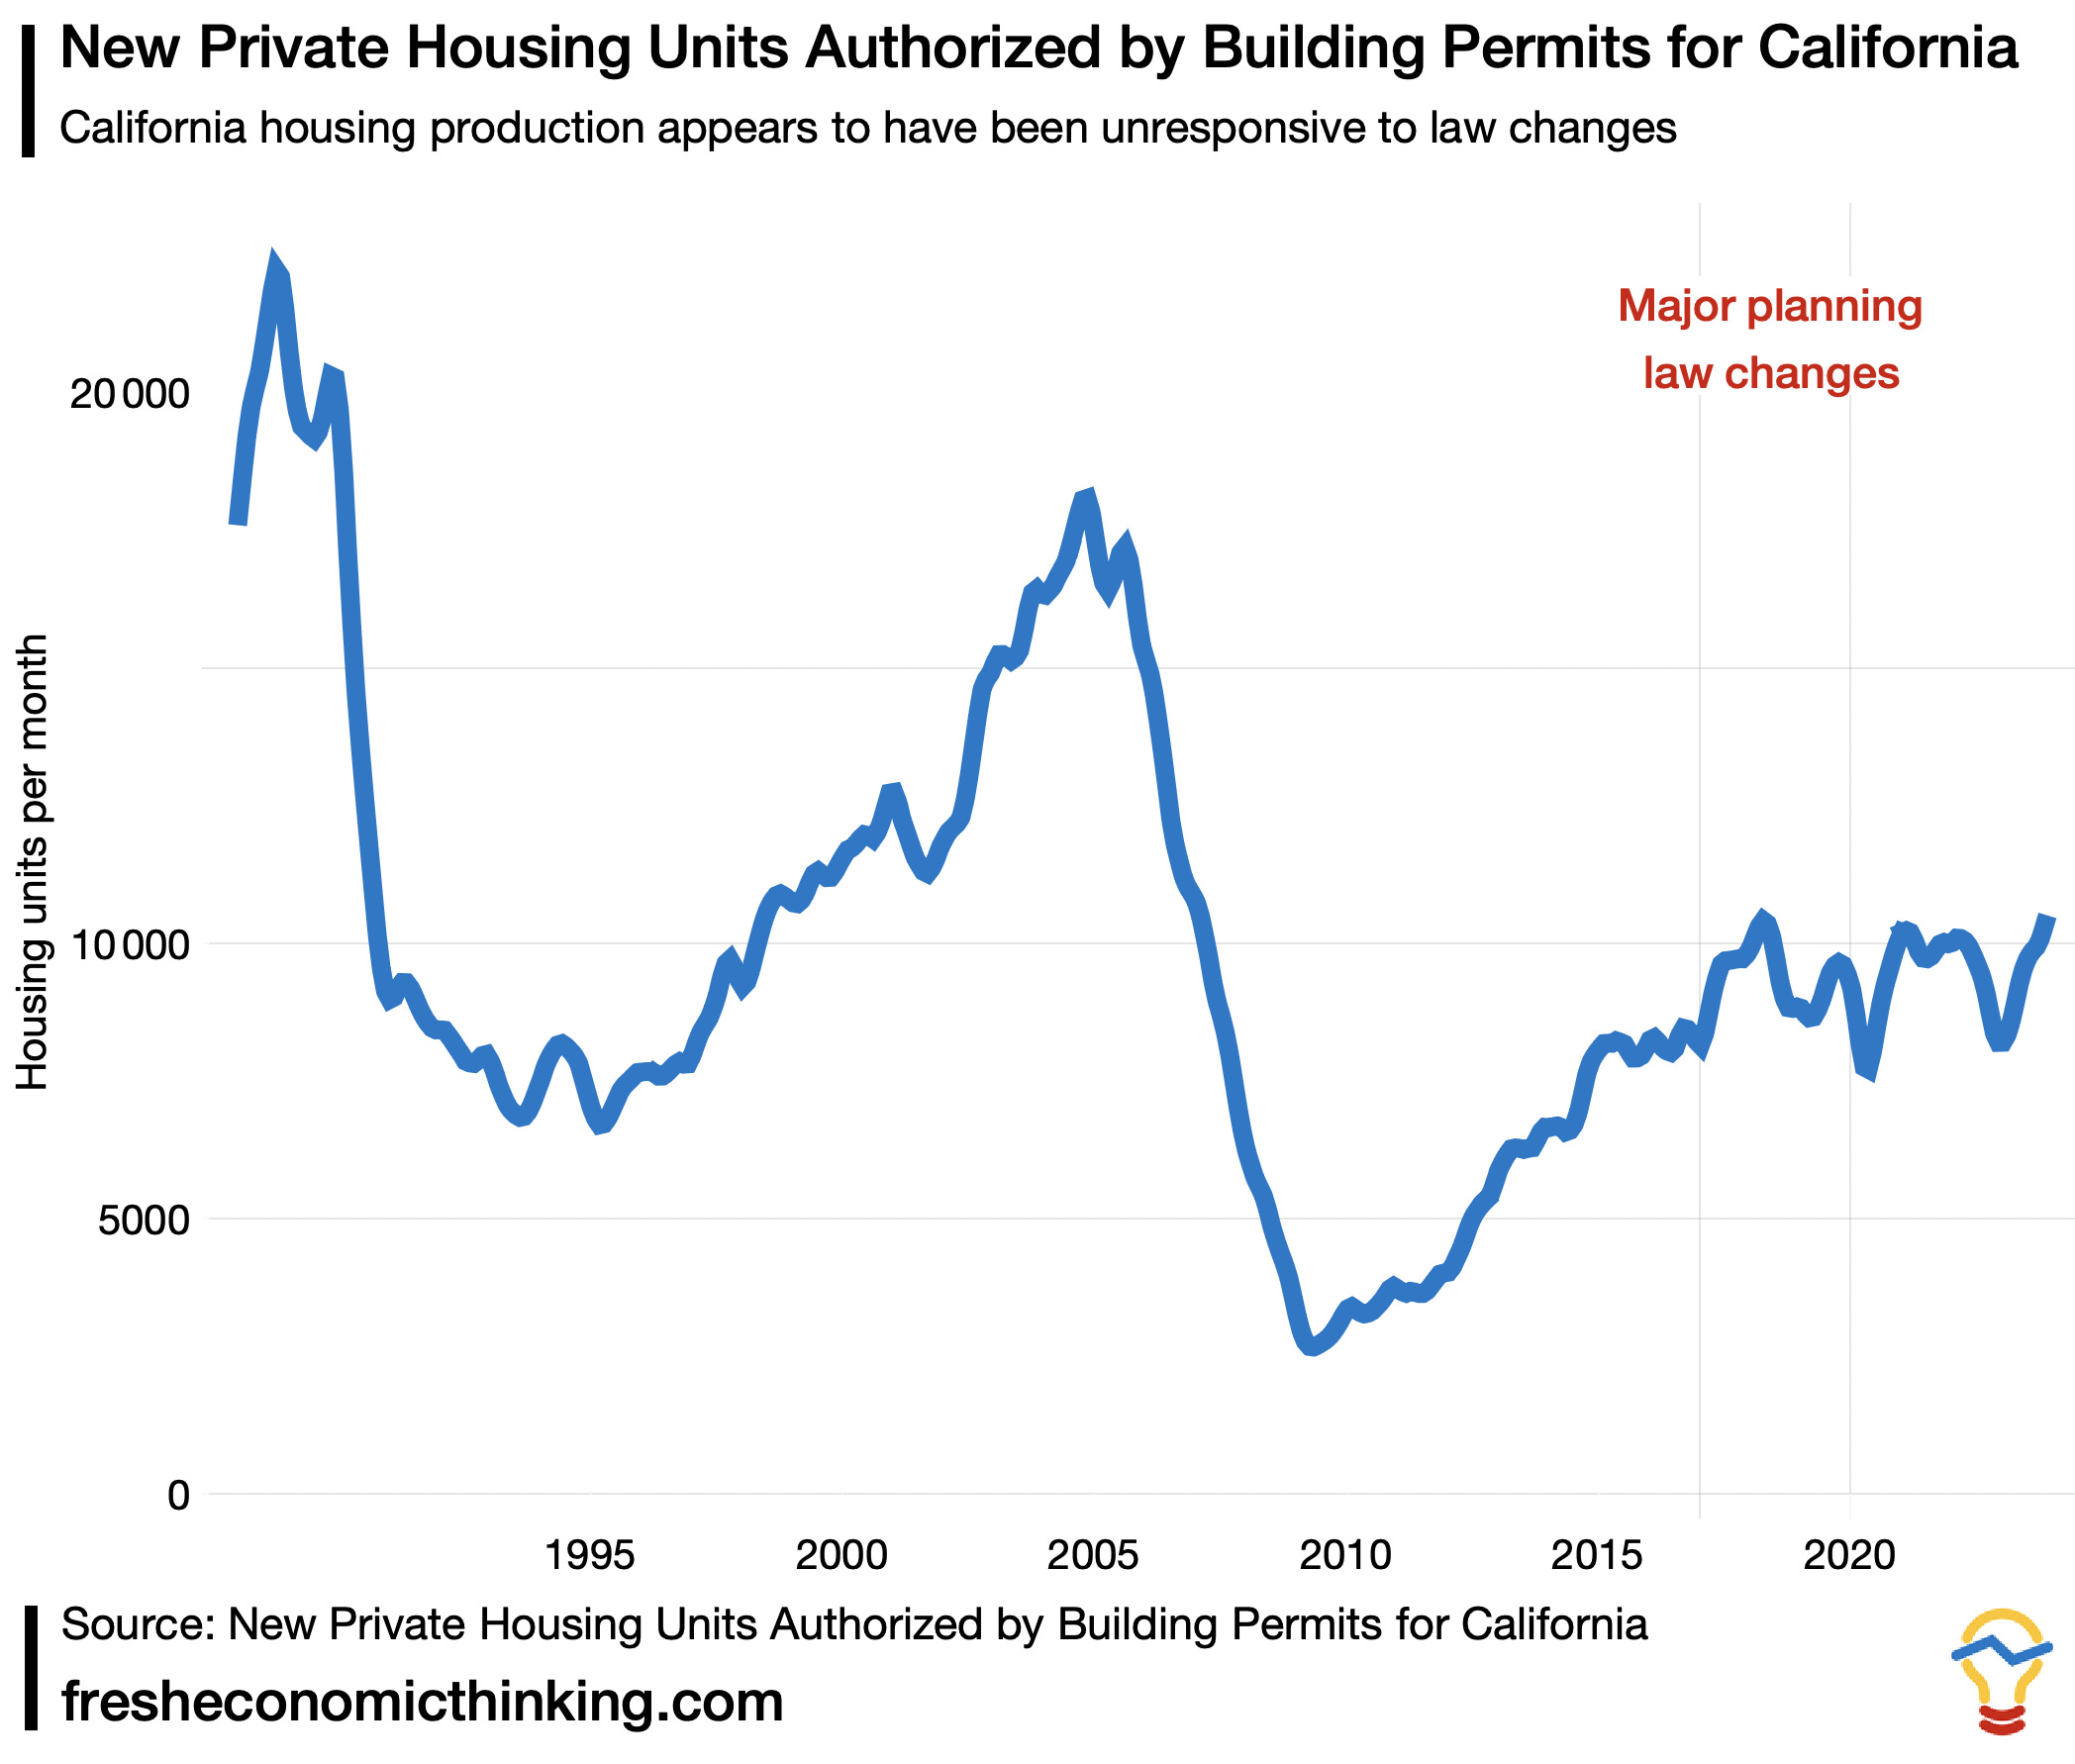
This provides a clue as to why the uptake of SB9 failed to meet expectations. Sure, streamline housing approval processes and relax planning regulations if you think that could lead to better city designs.
But remember that the overall rate at which those opportunities are taken up is extremely dependent on the optimising choices of private property owners to economic conditions. And these economic conditions always bind.
You can create as many feasible sites as you like. Still, economic conditions (including population and migration pressures) will regulate how quickly they get taken up because private property owners can wait for better conditions.
This previous article of mine steps through why that is likely the case.

Are conditions too onerous for property owners?
Researchers have moved to argue that the problem with all these planning law changes is that they often involve some form of inclusionary zoning, whereby a certain number of below-market rentals must be supplied to take advantage of the higher allowable development density.
This might be true in many areas where development feasibility is marginal at best. My personal preference is not to regulate private property owners to provide below-market housing but to do it directly with public and subsidised housing institutions.
But this argument points again to an economic constraint on whether housing can be made cheaper with new supply, It is what I call The Great Housing Supply Contradiction. It cannot be true that small financial costs to property owners make projects unviable and also that housing will be produced so rapidly as to impose this cost by pushing down rents.
This is why we now hear things like this about getting more housing in some parts of California.
We’ve got to be real. One of the challenges we face in San Francisco is we need the rent to go back up to get housing to work. And that’s both counterintuitive and sort of insane to say out loud, but it’s the truth of things.
Any comments and further details from insiders to help this outsider understand are appreciated in the comments.
Advertisement – Fat Tail Investment Research
Fat Tail Investment Research is an Aussie outfit that publishes research on a range of investment options. The people there have been readers of my work for many years.
Sign up for free using this link for their investment insights about stocks that historically pay a consistent income AND could deliver capital growth.

This appears to be a second attempt at SB1120, which was also optimistically assessed by housing analysts.
California HCD dashboard can be found here: https://www.hcd.ca.gov/planning-and-community-development/housing-open-data-tools/housing-element-implementation-and-apr-dashboard
The data, including SB9 permits, can be found here: https://data.ca.gov/dataset/housing-element-annual-progress-report-apr-data-by-jurisdiction-and-year
I think there were 355 SB9 permits in 2022.
Knock yourself out.
Extra credit is to understand that in order to fulfill Federal "Affirmatively Furthering Fair Housing" policy, HCD implements policies that literally attempt to income-integrate each and every "Racially Concentrated Area of Affluence ("RCAA") ,i.e. neighborhood, no matter how affluent. And the tool is upzoning. If cities upzone to either 20du/acre or 30du/acre the State pretends that that is "multi-family" enough to produce housing affordable to "low-income" families, and it will credit the proposing city with meeting its AFFH requirement.
Overlay the US 18.6-year Real Estate Cycle over that chart above and its like turnig the light on in a dark room. One thing thats obviously impossible to quantify, and yet history tells me it's coming, is sentiment.
One day, in the near future, the FOMO merchants will become the ones making all the noise. And that sentiment will see a shift in many land owners who are currently on the sidelines unwilling to enagage with these new planning laws.
Then consider the battleground that will become the mortgage market. Sizes of mortgages wont reduce, but the requirement for a deposit, less regulatory paperwork and much easier servicability rates is what lites up the groundswell of "we are missing out here if we dont get in now!"
Recheck that chart, 1995 to 2007. This is what awaits the US land markets...