
Australia's dual-income families
Is our memory of single-income families accurate?

Thank you for subscribing to Australia's newest think tank, Fresh Economic Thinking.
For new readers, my book, The Great Housing Hijack, will be released on 27th February 2024. If you want to understand the economics of housing markets and why everyone claims to want affordable housing, but no one wants cheap housing, this book is for you.

In housing debates it is common to hear either that
more dual-income families mean more money bidding up rents and prices, or
high housing rents and prices are why families now need two incomes.
I get the intuition behind such claims.
But I think such comments are reflect the past through rose-coloured glasses. Just like the image above, these memories can be a bit artificial.
So, what does the best data show about the rise of dual-income families, and how should we think about the economics at play?
A century long view
In 2020, overall female labour force participation was 61% across all age groups. In 1920, it was about 25%. But as the chart below shows, the big shift took place from 1960 to 1990. By 1991 it had already doubled to be above 50%.

Young women shifted into the workforce during the Second World War, with a large boost in 15-19 year old women (and men) working between 1933 and 1947.
The big picture of the second half of the 20th century is that the youth began working less (both male and female) and in general, more women began working while fewer men did.
We need to remember that the 75% of women not in the formal labour force during the first half of the 20th century were mostly still working. The informal household economy was much bigger than today, especially in terms of the time needed for cooking, cleaning, etc.
In terms of housing, prior to the Second World War, homeownership was only about 43% in Australia’s urban areas. So there were a lot of single-income households, but not many buying homes.
1960s and 70s
The 1961 census recorded that of married Women in Australia, 25% of them aged 20-24 were working, while 17% of them aged 25-34 were employed (p224 of this census report). This suggests something of a decline in working after married women had children, which makes sense, as child-rearing is a time-consuming activity (a job of sorts) and in the 1950s and 1960s there will plenty of children about.
We can look to the 1971 census to see how these figures changed. By then, over 44% of married women aged 20-24 were working, up from 25% a decade prior. For married women aged 25-34, 33% were working in 1971, up from 17% a decade prior.
By 1981 the proportion of married women aged 20-24 in the workforce had increased to 57%. For those aged 25-34, it was 49%.
In terms of housing, it is interesting to note that the homeownership rate in Australia peaked in 1971. During the 1960s married women worked more and homeownership increased. In the 1970s even more married women worked and homeownership decreased.
The dramatic scale of the changes to married women’s workforce participation in the two decades of the 1960s and 1970s is clearly seen in the below chart.

The 1981 census also broke out parental labour force participation. This helps to understand more about dual-income families with children (as there are many married couple households without children, either before kids or after the kids have left home).
In that year, 44% of couple families with at least one child aged under 16 had two parents working. If we include unemployed mothers (who are not working but looking for work), the number is closer to 47% and is not much different from the 49% figure on the proportion of married women in the labour force aged 25-34 from that same year. Which means that most married women aged 25-34 had at least one child at home, and nearly half of them worked.
The 1980s onwards
From 1979 onwards, we can also look at households with children specifically using details contained in the monthly Labour Force Survey (rather than the census) to get a better feel for the changes over time.
Below I’ve plotted the proportion of dual-income couple households (with and without children) for the past 45-years from this data source. Unfortunately it does not differentiate between full-time and part-time work.
Nevertheless, it shows a continuation of the trend of rising dual-incomes. During the 1908s, dual-income families with children grew from 41% to 55%. It took from 1990 to 2022 to rise another 14% points to 71%. Most of that change happened since 2014, with the dual-income rate for couples with children rising from 61% to 71% in the past decade.

I don’t know why there has been a steep rise in this trend since 2014. Perhaps a few factors are at play, such as having children later in life, child-care policies, or generally favourable economics conditions (i.e. both parents work when the payoff to working makes it worthwhile to give up the time for other household activities).
Share your ideas about this recent change in the comments.
Notable, homeownership rates, after steadily declining since the 1970s, started to increase for many younger cohorts from 2016 to 2021 (when comparing census years). I wonder if these extra dual incomes had an effect.
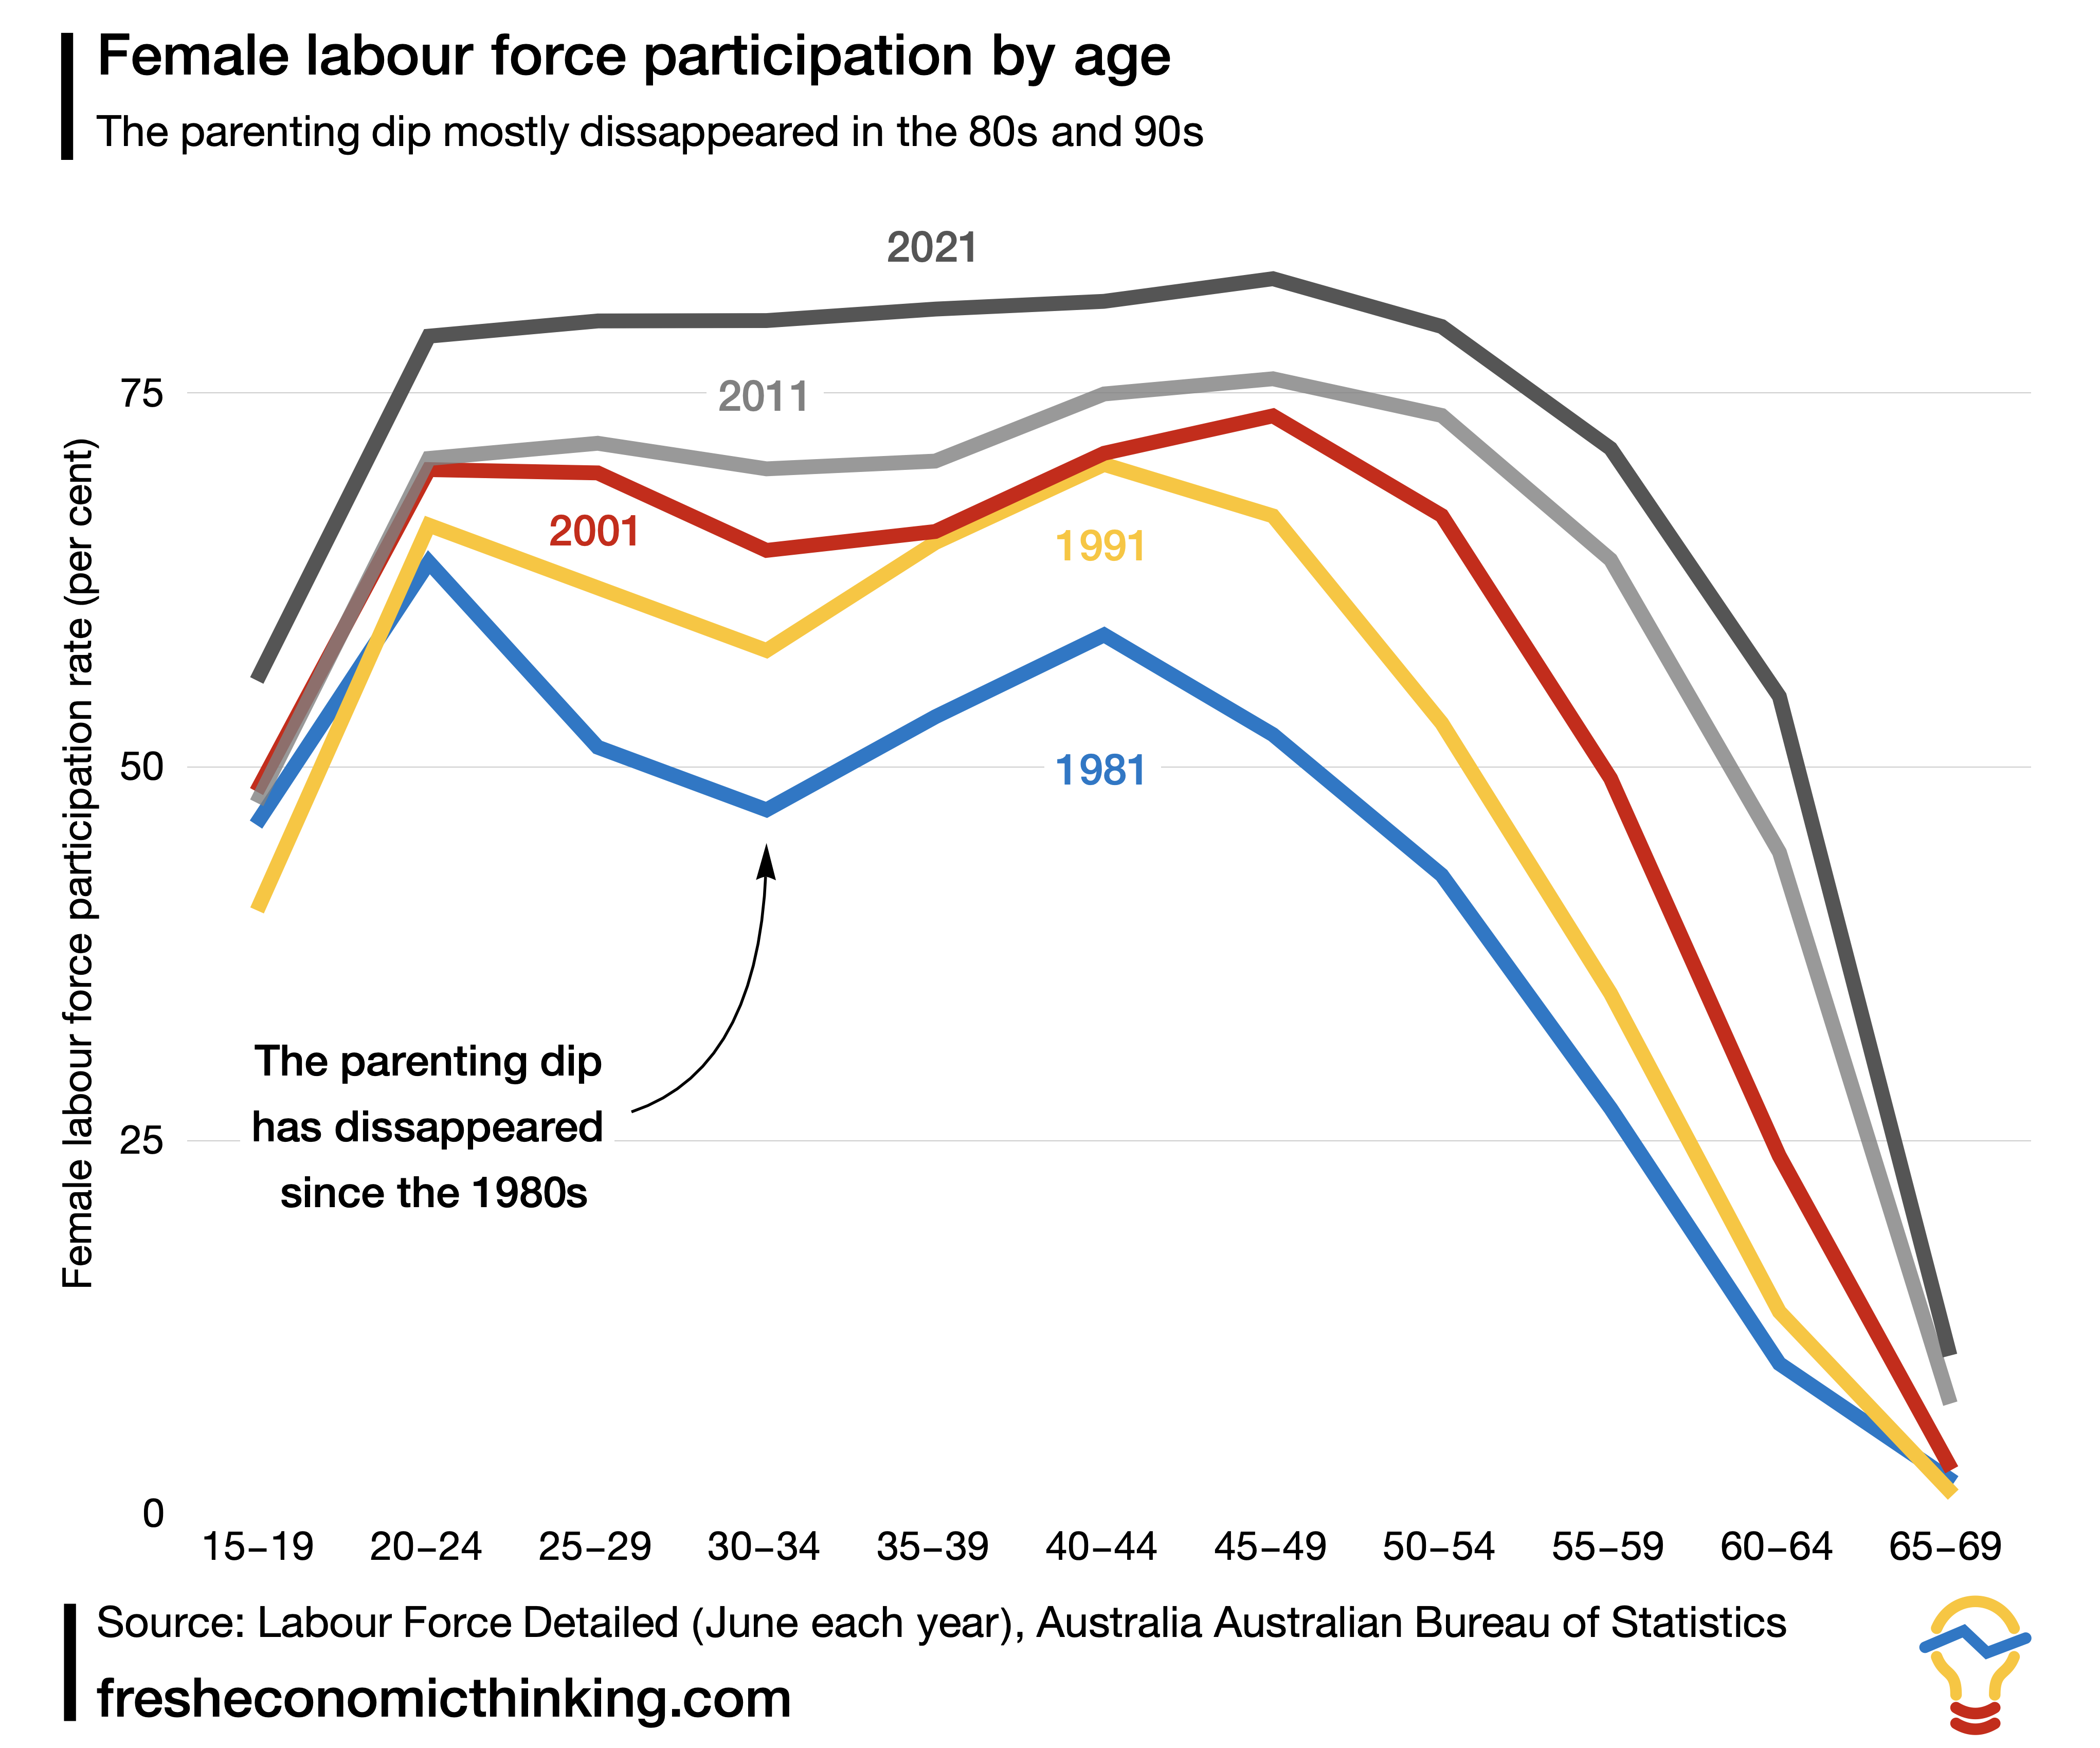
The patter above really is mothers working more, as the below chart below shows. Although family work patterns were changing dramatically in the 1960s and 70s, since then the big change is that the parenting dip, whereby mothers choose informal household work over formal work during child-rearing years, has gone. Most of the change happened in two waves, during the 1980s and in the last decade, consistent with the two periods of rapid change seen above.
But there is more to the story, as formal work is more flexible than ever and these charts lump in all work as equal, whether full-time, part-time or casual.
Part-time vs full-time in the past decade
Since 2011 we can also look at part-time and full-time employment.
There are interesting patterns here that I didn’t expect.
There has been a small but surprising decline in dual-income families with children where one parent works part-time and one parent full-time. Perhaps this is to do with the COVID effect of the 2021 census. We will only know in a few more years.
In contrast, however, there was a 3.4% point rise in dual-full-time families and a proportionally quite large rise in dual-part-time families.

Dealing with the single-parent family data seems more difficult, and perhaps I will take a closer look another time. It is not clear how to handle using the aggregate data cases of separated but single parents who share custody.
This has been an initial take at trying to understanding the history of dual-income families in Australia to see whether stories about how families used to be able to survive on one income really reflect reality.
What I learnt poking around the data is the following.
The early 20th century had minimal female participation in the formal labour force. Our memories of this period seem accurate.
Most of the big changes happened in the 1960s and 70s. The share of married women aged 25-34 working at all (part-time or full-time) increased from 17% to 49% in those decades. No doubt it was the households with more incomes that bought more homes in this period.
From 1980 to 1990, the proportion of couple families with children with dual incomes increased from 41% to 55%. The trend flattened out for 25 years but then took off again in 2015. I don’t know why.
The surprising trend from 2011 to 2021 has been more dual full-time couple families with children, slightly more dual part-time, but less one part-time and one full-time couple families.
So how do these numbers fit with the stories about how these days “it requires two incomes” to buy a home?
Honestly, I think when you look at the data you don’t really see much of a story with homeownership at all. What appears to be happening is that more households choose to be dual-income families during periods of economic growth, as the financial and time trade-off between a stay-at-home mother and working shifts towards working. These higher income households then also bid against each other to rent or buy homes in better locations.
It is certainly true that if, by coincidence, many dual-income households decided to become single-income households that rents and home prices would fall. But I just don’t see how this happens voluntarily. It seems that more likely we will go Dutch, where dual-part-time work households become more common during that parenting dip.
You say that households choosing to gather two incomes is driving price increases in the housing market, stating that the increased income is allowing said households to bid against one another to buy/rent homes in better locations. If this is true, then increases in house prices should follow increases in wage growth. Over the decade ending March 2022, wages grew 26% while average house prices in New South Wales grew 123% over the same period.
A 97% difference in the increases in wages and house prices comprehensively pokes a hole in the theory that housing price increases are merely driven by more households receiving two incomes. I think you will find that many people (particularly those buying their first property) are being driven into cheaper areas, rather than, as you suggest, bidding "against each other to rent or buy homes in better locations" due to the 97% drop in purchasing power from 2012.
Personally, I am struggling to see how the calculations to support your theory stack up, when there has been a 26% increase in wages, and a 123% increase in house prices. There are certainly other factors at play here; diminished supply through various means comes to mind. Whether it be investment by those with the existing capital base to do so, a physical shortage of the number of domiciles available, or some other factor. These housing price increases are far beyond the capability of wage growth and two-income households to support.
The chart 'Dual income families in Australia' is really surprising. Why would it be less likely for couples without children to have a second person working? Not only the levels, but also the gradient and point of inflection around 2013. Recently, increasingly, it's couples with kinds that have second-incomes. I wonder it it would be possible to disaggregate this between home-owners and non-homeowners as well. I don't even know whether the households with children are more or less likely to be homeowners. I certainly think that the popular desire to buy a place before having children could, and the increasing purchase prices of homes, could provide a powerful 'lock-in' effect for dual-incomes parents who got a mortgage that required both incomes to service. (Speaking somewhat from experience.) If you're renting, you could move to a new location that eases financial pressure if it it turns out it's too hard to parent with both parents in full-time work. But if you've busted guts for the last 5-10yrs saving a deposit for the home you just bought, it's pretty hard to walk that decision back.