Why home prices obey economics and price-to-income ratios are a shoddy market metric
A guest post by Arek Drozda
Quick notes from Cameron.
Arek and I have converged on the same approach to understanding home prices. This is why I am publishing his story and explanation here at FET. This core asset pricing approach is also embedded in my Speculative Index metric of cyclical prices.
Arek was also the person who originally directed me to Charles Darwin’s 1836 diaries and their comments on Sydney’s housing market. Thanks for the pointer.
Readers, a special request. FET referral rewards are now operating.
Use the share button on this or any other article, and you will get credit for any new subscribers who join. Simply send the link in a text, email, or share it on social media.
Get 5 referred subscribers, earn 1 month free to read all paywalled articles and access audiobooks. Get 10 referred subscribers, get 3 months free. Get 25, and get a year free!
By Arek Drozda
In Australia, it’s widely accepted, even taken for granted, that property prices are “too high” and that we’re facing a “housing affordability crisis.” Ask anyone on the street, or any so-called expert on a housing affordability panel, and the answer is always the same: absolutely, yes!
This perception isn’t new. It’s been part of the national conversation for decades, indeed, for centuries. Charles Darwin noted in his 1836 diary (p. 396) during his visit to Sydney: “... everyone complains about rents & difficulty in procuring a house.” Yet despite all the concern, debate, and endless policy talk, prices keep rising, again and again.
This is not because housing defies economic logic.
It is because the loudest people don’t know what determines the price of homes. They are confident. But they are consistently wrong.
This article shows why they are wrong and how the most basic economics of home prices gets it right, again and again.
Don’t forget that Fresh Economic Thinking is also on YouTube. Here’s the latest FET podcast on the cycles of Canada’s housing market.
A crisis of seduction
Strangely, there’s a certain allure to the “housing unaffordability crisis.” It taps into a visceral sense of injustice and is a perfect rallying cry for aspiring politicians looking to mobilise support around a noble cause. Never mind that the so-called “victims” might only make up a small fraction of Australians—that nuance gets lost in the noise.
For social media warriors and influencers, “saving the next generation” is a pure gold emotive hook that draws followers by the thousands. All the while, ironically, most of the young people in your own social circle are either buying property or well on their way.
Meanwhile, prominent economists make a tidy living producing endless content on “the many causes of unaffordability,” monetised via ad clicks, Patreon donations, or speaking gigs. Developers bankroll lobbyists under the noble banner of “making housing more affordable,” which conveniently leads to tax breaks, rezoning of tightly held land, and foreign-financed build-to-rent schemes that quietly bypass planning laws, all while boosting margins.1
And let’s not forget the crusade to “fix” negative gearing—not to level the playing field, but to push out pesky mum-and-dad investors in favour of large institutional landlords. Because obviously, private citizens owning property is the real barrier to affordability, right?
In reality, what we have is a powerful coalition of vested interests, all thriving on the narrative of unaffordability. And you, the conveniently outraged public, are served a carefully curated version of truth—just enough to stir emotion, but not enough to question the script.
And through it all, prices keep rising, again and again.
If you’ve made it this far, chances are you’re starting to fume a little.
“That’s nonsense! It can’t possibly be true…”
And I get it.
It’s uncomfortable to be challenged on something you’ve long believed to be true. Yes, I’m deliberately generalising a bit to provoke a reaction—to make you think.
But let’s cool the confrontation and shift gears.
Rather than arguing over who’s right, let’s reframe this as a shared mission to uncover a reliable, proven method for predicting future property prices in Australia. That way, you don’t have to abandon your views entirely, and I don’t have to convince you that you’re completely wrong.
Let’s neutralise the emotion and focus on the real question.
What actually drives property prices?
On a personal note…
I used to be one of the many naïve “truth seekers” who turned to the internet and social media, hoping to find answers. Like many, I gravitated toward media-visible “experts,” assuming they had insight. But the deeper I went, the more I realised: most were simply skilled at manipulating fear or greed, not seeking truth. Their advice and predictions didn’t just miss the mark; they were spectacularly wrong.
Take Steve Keen. Once hailed as a bold contrarian economist, he is now best known for his failed bet that Australian property prices would crash by 40%, and for his symbolic march up Mt Kosciuszko in defeat.
Yet he is again being recycled by the media, rehashing the same narratives. My experience with figures like this has only reinforced the need to speak out, especially because with thousands of uninformed followers, many lives will be impacted.
In truth, 99% of those I’ve encountered fall into this category: confident, loud, and consistently wrong.
From where I sit, it’s baffling.
Why do otherwise rational people keep trusting expert advice that consistently misreads what drives the property market? Why accept panic-driven headlines that never explain what happens next?
For decades, we’ve heard the same warnings of a crisis, yet hundreds of thousands still buy property every year, and prices keep climbing. If something is truly “unaffordable by a long shot,” how does its price continue to rise year after year, decade after decade?
Do supply and demand, or any economic law, still apply?
When asked why, the experts offer little more than vague theories and hand-waving.
As Forrest Gump’s mother put it: “Stupid is as stupid does.”
Or as per this old saying: “Fool me once, shame on you; fool me twice, shame on me.”
And then there’s that infamous line, often misattributed to Einstein: “Insanity is doing the same thing over and over again and expecting different results.”
(For the record, the quote first appeared in Rita Mae Brown’s 1983 novel Sudden Death.)
My claims to fame…
Back in 2014, I published an article outlining what I believed to be the most likely trajectory for Australian property prices over the coming decade. My view stood in direct opposition to the popular media narrative at the time, especially from high-profile pessimists.
I was ridiculed for it. Yet, events unfolded almost exactly as I predicted.
The point is: I’ve demonstrated a track record of anticipating property price movements with a level of accuracy that most so-called experts have failed to achieve. My analysis is based on a sound, independently developed analysis that sticks to the basics.
Interestingly, I later discovered that others had reached similar conclusions, including the Bank of America Merrill Lynch Global Research team, whose findings were intended for private clients only. That insight eventually reached the public via none other than Saul Eslake.
Unlike the noisy forecasts pushed by most media darlings, my work delivered results. It’s all on the public record. The full 2014 article is republished here for your review.
The simple model
What exactly is the basic economic theory that enabled me to forecast Australian property price trends so accurately, and what was the prediction based on?
Here’s the core model, summarised in nine key points:
There are only two practical housing options for most people: renting or buying.
These are direct substitutes for one another, meaning most people will either pay rent or make payments to own. There’s no third path for the majority.Renting and buying incur comparable ongoing costs.
Renters pay rent; buyers face the “cost of buying,” which includes mortgage repayments and ownership expenses. Because renting is a substitute for buying, these two costs are intrinsically linked and should be viewed in relative terms.Most buyers rely on finance, meaning their decisions hinge on what they can afford annually, not on a property’s asking price.
The property price itself matters only in terms of how it translates into mortgage repayments. If the annual cost of buying (mortgage, rates, maintenance, etc.) exceeds the buyer’s financial capacity, they’ll look for a cheaper alternative.
Since the mortgage is usually the largest part of the buying cost, it can be considered as a reliable proxy for the buyer’s full buying cost.
For simplicity, I modelled the annual interest on a median-priced home (assuming a 100% loan) as a consistent measure of the “cost of buying.” Because the model focuses on change over time, precise dollar values aren’t critical; only the relative shift in cost matters.
The two key variables that determine a buyer’s ability to borrow (and therefore purchase) are income and interest rates.
I used full-time adult average weekly earnings (from the ABS) as a proxy for income. It’s simpler and more representative than “household disposable income,” which includes persons not in the workforce, and the standard mortgage rate (from the RBA) as the cost of borrowing.
The relationship between income and interest rates is the core of the model.
It defines borrowing power, or the capacity to take on debt. For instance, a $10,000 rise in income gives access to $100k in extra borrowing at 10% interest, $200k at 5%, and $500k at 2%. As interest rates fall and incomes go up, borrowing power rises sharply.
Other factors like unemployment or housing oversupply do affect prices directly, but are excluded from the model for good reason.
A full explanation of the reasons is beyond the scope of this article, but briefly, changes in interest rates and incomes act as balancing factors that can offset the impact of other variables on property prices. For example, during the 1991 recession, high unemployment didn’t cause a housing crash because interest rates plummeted, significantly reducing borrowing costs and effectively putting a floor under property prices. Similarly, Sydney’s 2002–2005 construction boom didn’t push prices down significantly because it coincided with strong income growth and relatively stable interest rates. These factors kept buying costs affordable and prices stable, effectively offsetting the supply surge.
Capital repayments are treated as forced savings.
They don’t count as a cost in this model because they build equity. Buyers are not “losing” that money but are converting debt into ownership.
In summary, property prices are driven by income and interest rates.
As these two variables change, so does affordability, which determines how much buyers can (and will) pay. That, in turn, drives prices.2
Past model forecasts…
My 2014 forecast for property prices over the next decade was based on three distinct scenarios: two extreme outcomes to define the outer bounds of expectations, and a most probable mid-range scenario assuming prevailing economic conditions followed historical trends.
The starting point of my analysis was the estimate that, in 2014, property prices were likely undervalued by up to 45%, creating substantial upside potential. I anticipated that a price increase could materialise either very quickly, possibly jumping by 10–30% within just 12 to 24 months if favourable economic conditions persisted, or these gains could be delayed if pessimism dominated market sentiment. In the latter case, the increase could be even more pronounced, compensating for the time lag.
The actual outcome? House prices surged by 17% within 24 months, and by up to 34% over four years, to March 2018.
My upper-bound estimate projected a 140% increase in prices by 2023, assuming a persistently low interest rate environment (around 5%). Under a high-interest-rate scenario (10%), growth would be more modest—only around 20%.
Under the most probable scenario, which included more realistic assumptions of moderate income growth and average interest rates of around 7% annually, I projected a 60% increase in property prices over the decade.
The actual average mortgage rate between January 2014 and December 2023 was 5.57%, while incomes grew by approximately 30% (~3% per year). House prices during this period increased by 70-80% (depending on the data source used), slightly exceeding my mid-range forecast.
I also considered the possibility of a 40% drop in property values, which is the “worst-case” scenario that some had hoped for. However, I concluded that such a decline was only feasible under extreme economic conditions. For prices to fall by this magnitude, mortgage rates would need to remain near 20% for most of the decade, coupled with income growth stagnating at just 2% annually. In short, while possible, this outcome would have required a perfect storm of negative economic factors.
Analysis of model results
Looking at income growth alone, without accounting for movements in interest rates, tells only half the story. Yet this is precisely where the vast majority of commentators stop. They fixate on the “diverging lines” or the “expanding gap” between house prices and incomes, declaring a crisis without ever uncovering the underlying dynamics.
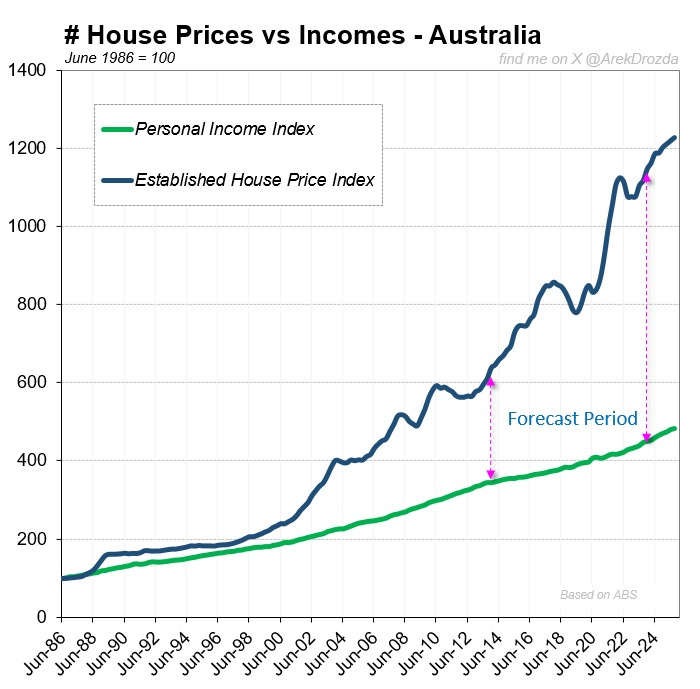
What they miss is that the relationship between incomes and prices is real, but not linear. Instead of observing how the relationship actually behaves, many analysts assume how it should behave. That’s where the logic collapses. The familiar narrative that “prices are out of control” has been repeated for decades because of this flawed reasoning.
The model presented here provides a far more accurate reflection of reality.
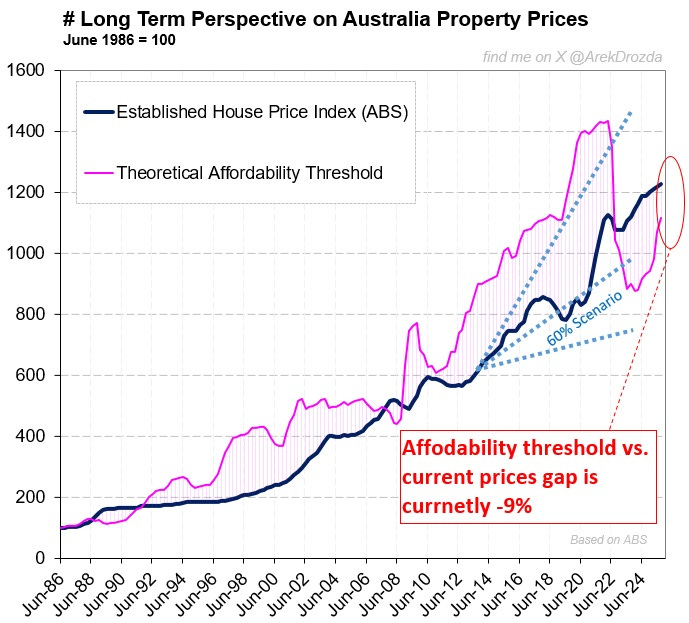
First, it quantifies borrowing capacity—the true affordability threshold—for an average full-time income at prevailing interest rates. Back in 2014, there was already a significant gap between what people could afford and actual prices. That gap widened in subsequent years, signalling substantial upside potential in prices. And indeed, prices rose strongly for years afterwards. The key takeaway: property is affordable more often than not—and when it is, prices tend to rise.
However, recent interest rate hikes, combined with ongoing price growth, have eroded affordability sharply. According to the model, something has to give: either prices ease, interest rates fall, incomes rise, or some mix of all three.
Second, the model directly compares the cost of buying a median-priced home (based on current rates) to both average incomes and rental costs. This context reveals whether buying is genuinely affordable relative to renting—the key substitution effect often overlooked in mainstream commentary.
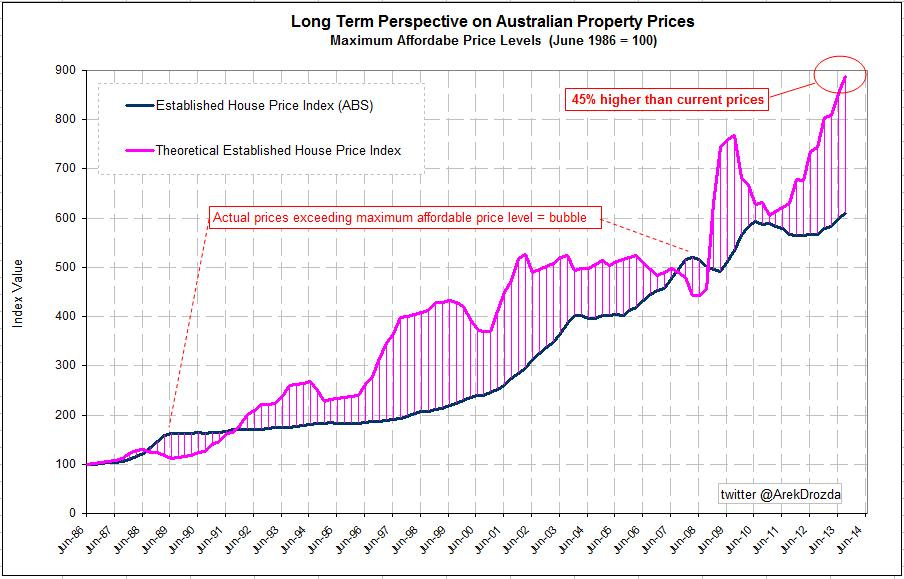
The accompanying chart neatly illustrates four decades of change in Australian property prices, including the 2013–2023 period covered by my forecast. The interplay between incomes, rent costs, and buy costs is immediately visible. While overlaying property prices makes the picture somewhat busy, it also powerfully demonstrates the causal link between affordability (buy costs relative to incomes and rents) and price behaviour.
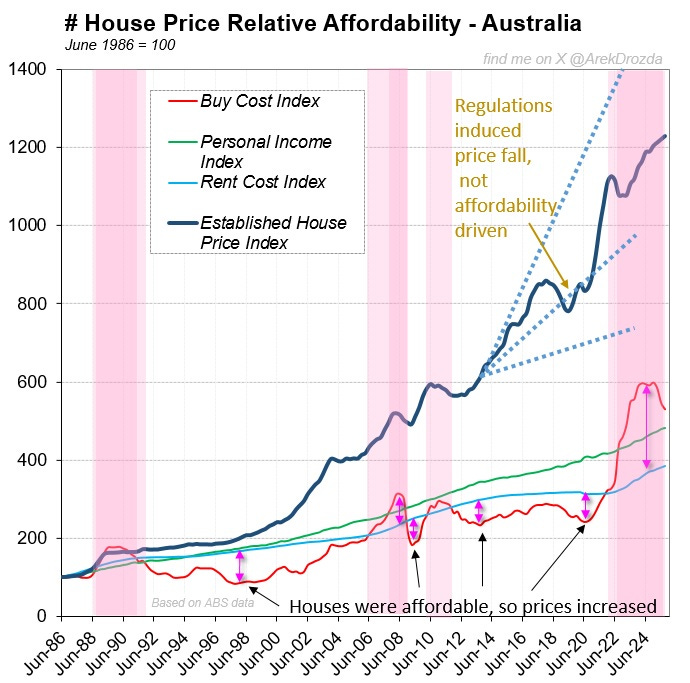
When buying costs are low relative to incomes or rents, as they were in 1991–2006, 2009–10, and 2011–22, property prices expand. When buying becomes expensive, such as in 1988–91, 2007–08, 2010–11, or since 2023, then prices stagnate or retreat. The pattern is logical, causal, and consistent.
To conclude, the correlation between the cost of buying and income over the past 40 years is 0.86. Since buying cost is derived directly from prices and interest rates, it follows that almost the entire variation in property prices can be explained by just two factors: incomes and interest rates.
The “thousand other reasons” so often cited to explain price movements? They’re mostly just noise.
Final word…
This way to understand home prices has a strong track record of accurately describing the past and, therefore, offering a high degree of confidence in forecasting the future. It is grounded in sound economics and is hence universally applicable, having been tested using data from Australian capital cities and London, UK.
The methodology outlined here is transparent enough for anyone to replicate the results, and if you want to try other variations of inputs in terms of income measures or interest rates, then be my guest.
You won’t find a better way to explain the Australian property market over the past four decades. Like it or not, the results speak for themselves.
I hope you’ve found this exercise educational—and maybe, just maybe, this journey of discovery will help shape your future views on what truly drives property prices.
As always, please like, share, comment, and subscribe. Thanks for your support. You can find Fresh Economic Thinking on YouTube, Spotify, and Apple Podcasts.
Interested in learning more? Fresh Economic Thinking runs in-person and online workshops to help your organisation dig into the economic issues you face and learn powerful insights.
Cameron here. Since the equivalent cost to “renting a home” for an owner is the cost of “renting a mortgage”, any price-to-income ratio needs at a minimum to be multiplied by the interest rate to make a sensible economic comparison. Not doing this is shoddy analysis.
As I often tell people, a $1 million home is cheap to own at 2% mortgage rates, costing only $20,000 per year to be an owner. But at a 6% mortgage interest rate, it costs you $60,000 per year. At a conservative $100,000 household after-tax income, one scenario is cheap, costing just 20% of income, and one is absurdly expensive, costing 60% of income.


Going to throw out an opinion that might be a bit unpopular because it goes against the type of populist views that exalt the 'mum and dad' little guy trope.
The author mentions a few things about negative gearing, and remarks that changes to negative gearing serve less to level the playing field and more to "to push out pesky mum-and-dad investors in favour of large institutional landlords". The tone and sentiment seemingly implies that he may have sympathetic views towards the average mum-and-dad investors, and may view them as being unfairly disadvantaged in the face of institutional investors.
Firstly, large institutional landlords also take advantage of negative gearing tax concessions, so it's not exactly clear how reforming or abolishing negative gearing tax concessions would favour them over the mum-and-dad investor types.
Secondly, while it's a common trope that mum-and-dad landlords treat their tenants better than large institutional landlords, I've never seen any actual evidence to back up this view.
I've seen plenty of anecdotal claims about large institutional landlords being terrible to their tenants, but I've also seen plenty of anecdotal claims about mum-and-dad landlords being terrible to their tenants.
It honestly just seems like some whishy-washy idealistic trope about how the mum-and-dad investors are so noble and great, even though there's no firm evidence that indicates that they're better landlords than large institutional landlords.
Thirdly, while there'll always be a demand for rental properties from certain segments of society, it doesn't exactly change the fact that most tenants don't exactly want to be tenants. Opinion poll research on tenants conducted by the AHURI generally shows that a large majority of tenants would prefer to own their homes outright rather than being renters.
I bring this up, because plenty of tenants who show up at auctions hoping to buy their first homes end up getting outbid and blocked from buying their first homes by cashed up 'mum-and-dad' investors, who in turn become their landlords.
Mum-and-dad investors buying rental properties does increase the supply of rental properties, which on the surface would push rental prices down.
But they simultaneously stop potential first-home buyers from buying their first homes, which forces them to remain in the rental market longer. This keeps the demand for rental properties higher than it otherwise would be, which helps to counteract any lower price effects that the increase in rental supply would cause.
I'm more sympathetic to those who are trying to buy their first home, rather than those who are trying to buy their third or fourth home. It genuinely doesn't matter if a landlord is a large institutional investor or a 'mum-and-dad' investor, they're both going to crowd out potential first home buyers and keep them trapped in a rental market they'd prefer to leave.
Fourth, there's not exactly any strong evidence that negative gearing has kept housing prices down, but as a tax concession, it still takes billions of dollars out of the federal budget each year. That's money that could be used for something like the type of public housing developer that Cameron Murray advocates for.
Even if you don't think changing negative gearing will have any positive effects on housing prices, it's still a waste of money that could be used for far better use.
An interesting article but also a cheeky strawman. When people say prices are "too high", many if not most are talking about the increasing burden on society of devoting more and more of national income to just putting a roof over our heads, as well as the increasingly unequal distribution of housing. Just because house prices may be economically sustainable (though I question that given how we are funding this by increasing leverage and pushing more debt into the future), does not mean current prices are desirable, whether from an economic, social or political perspective