
The Consumer Price Index (CPI) is a chameleon
The way inflation is measured changes to suit our economic environment

Thank you for reading Fresh Economic Thinking. Please subscribe and share this article.
Paid subscriptions are available, but for now, only get you good vibes. In 2024, better things are coming. My new book, The Great Housing Hijack, will be released and with your help, Fresh Economic Thinking will evolve into Australia's newest think tank.

The Consumer Price Index (CPI) sits at the heart of a great deal of economic analysis. We apply it to a broad range of circumstances to modify nominal dollar values into comparable ‘real’ dollar terms, and our central bank has relied heavily upon it since mid-1993 when it found practical expression for its statutory objectives for monetary policy in the form of a 2-3% inflation target.
But the real truth of the matter is that the CPI we all know and love is a chameleon.
The CPI from the 1950s is not the same economic indicator as the CPI from the 1990s and is very different to the CPI of the 2020s. Over long periods, the CPI becomes less useful for making ‘real’ comparisons. So be cautious when examining long-term ‘real’ trends in any economic data.
With this in mind, it is useful to explore some of the major historical changes to the CPI.
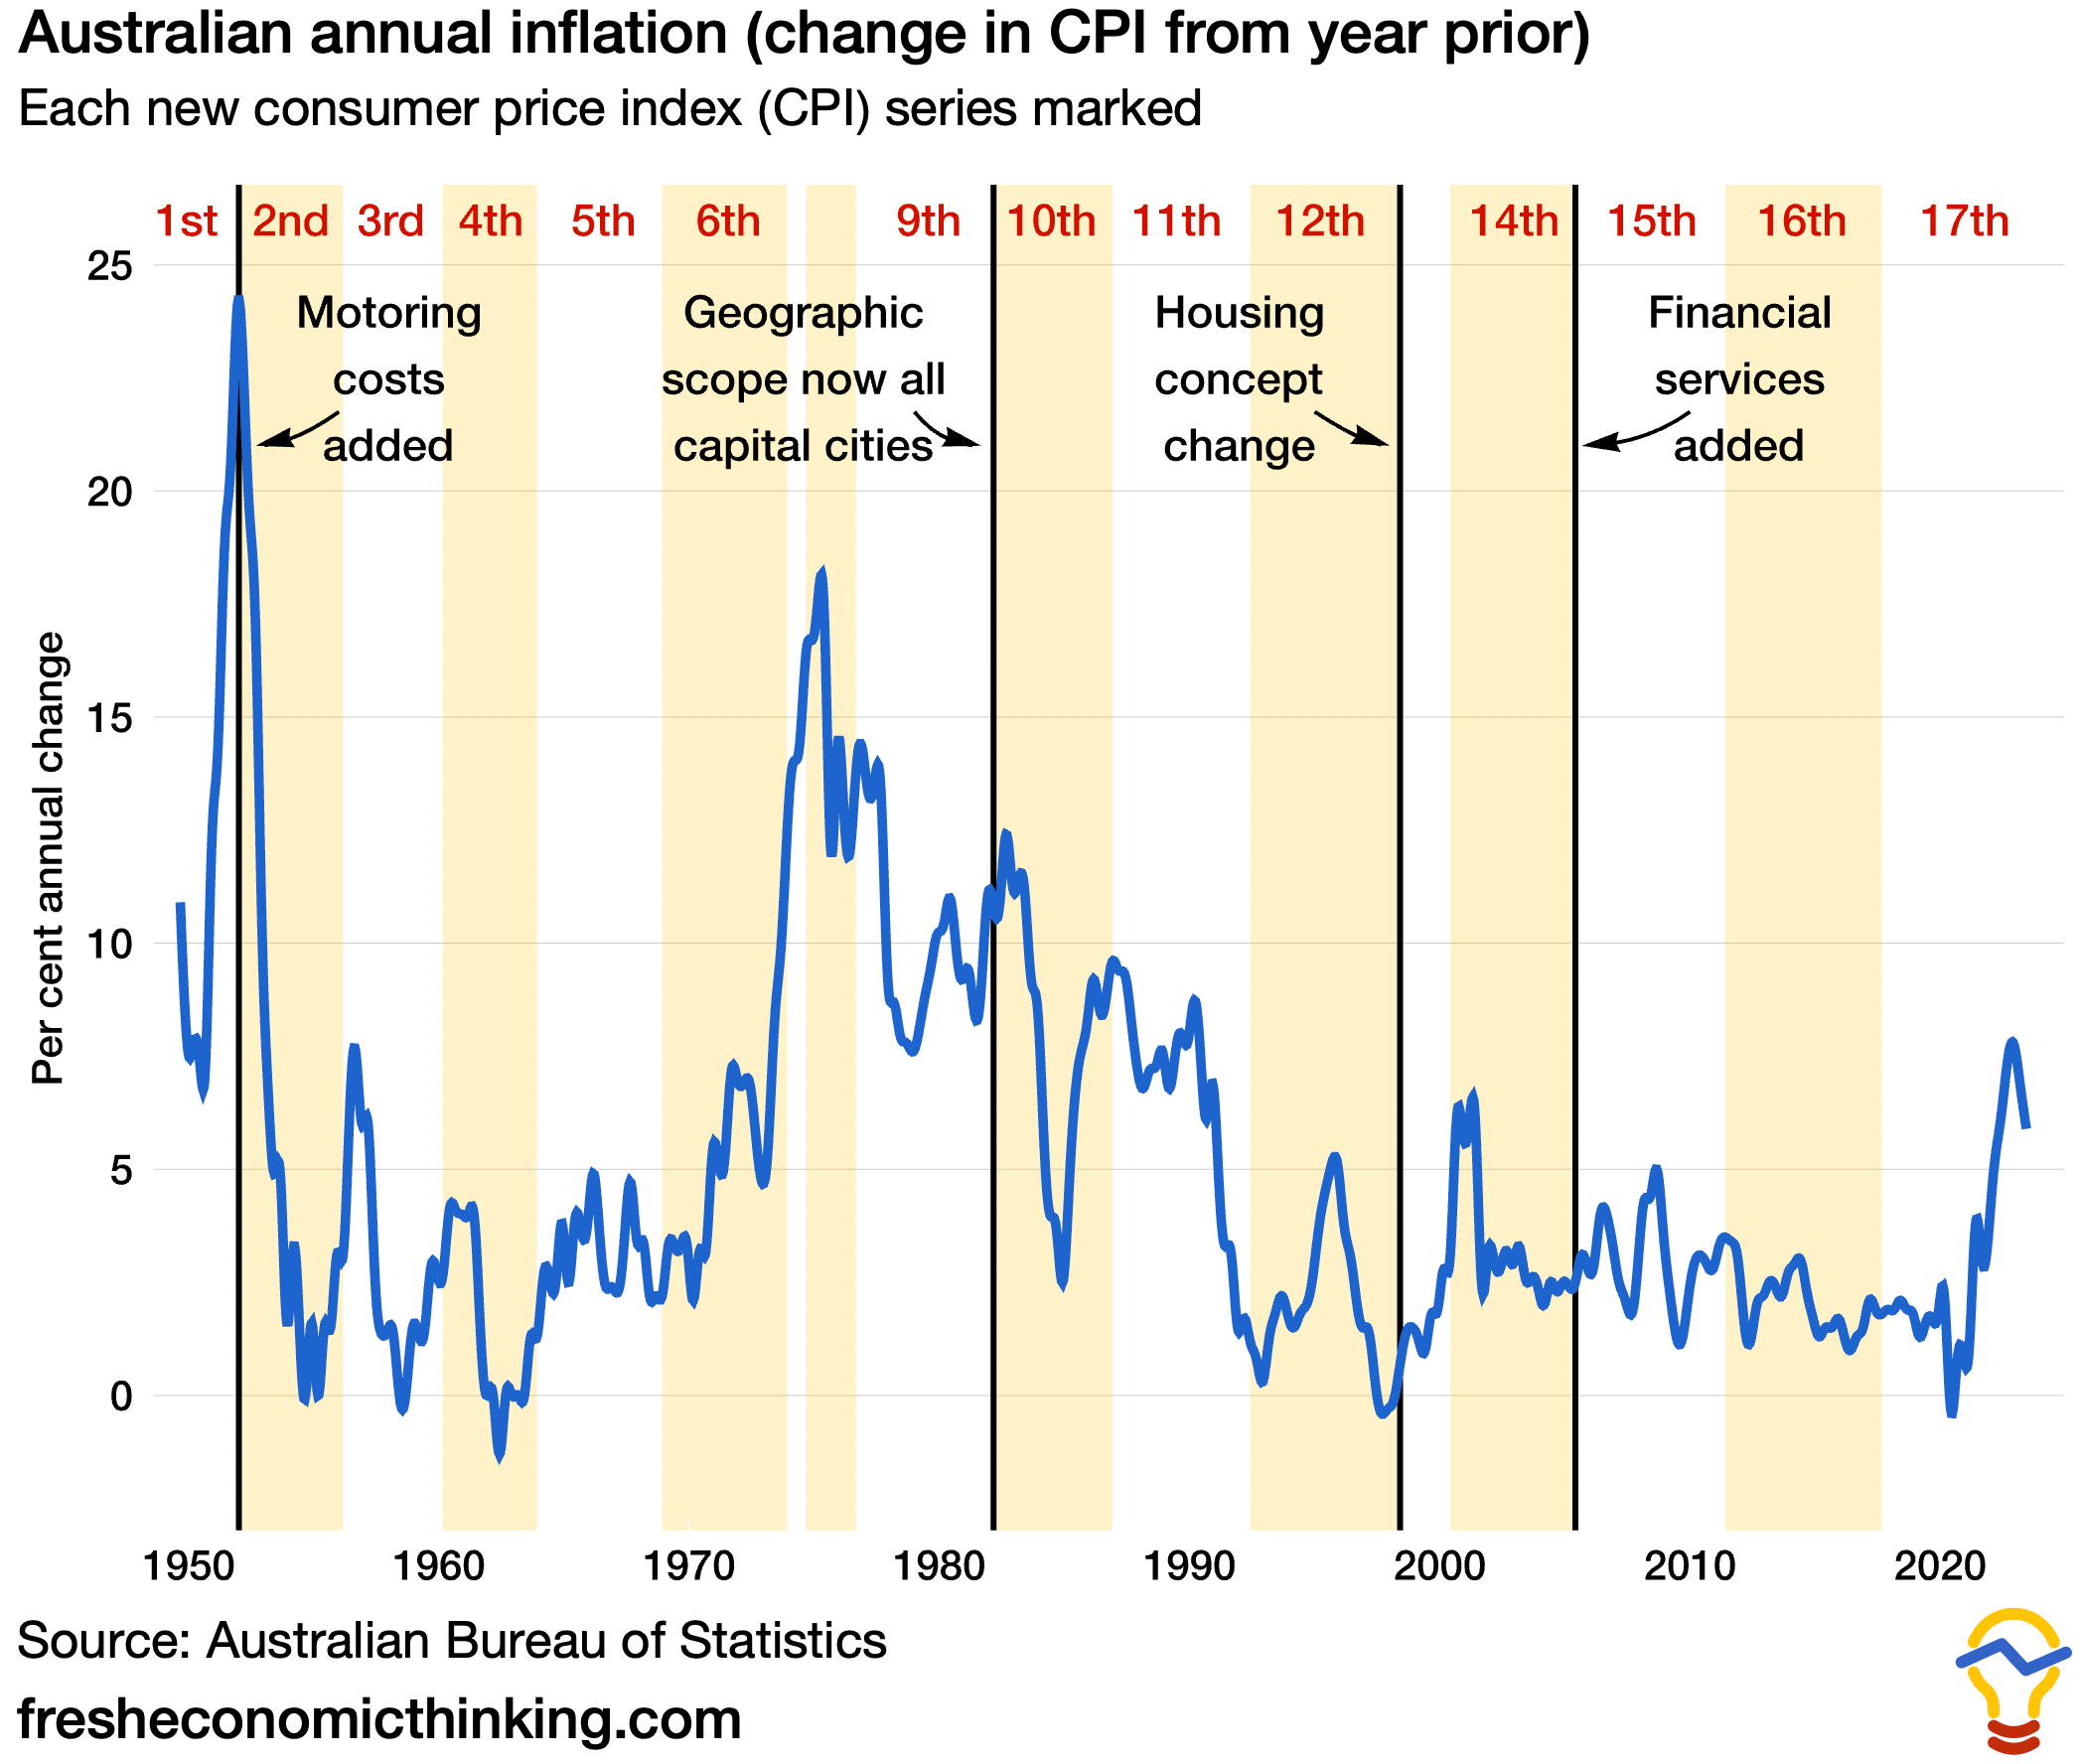
Below is a graph of the annual CPI change, known as the inflation rate, since 1949.1 On the graph, I have marked the sixteen times the ABS changed the index, with most changes involving updating the weights applied to each consumption item, but with some changes being far more substantial.
In its original incarnation, the CPI was used to estimate changes in the cost of living and often used to inform wage and salary negotiations. As an index, it was relatively unsophisticated. For the curious economic historian, the original 1948 components of the index and weights are shown in the table below (a brief history of the CPI pre-WWII is here)

One thing that strikes me from 1948 is that the massive 21.60% weighting to clothing, out of which 10.1% is women’s clothing and only 6.2% is men’s and children’s clothing. In the current 17th series, only 3.55% of the CPI basket is for all clothing and footwear.
The first few revisions of the CPI were mainly centred around improving the specification of the basket of goods. The 2nd series introduced expenditure on ‘motoring’ while the 5th series introduced furniture, frozen vegetables and newspapers and magazines into the basket based on the 1961-62 census of retail establishments.
Bigger changes were to come. The 7th series refined the basket weightings even further based on the 1971 census, the census of retail establishments and the new survey of motor vehicle usage. Newspaper and postal services were added.
Advertisement – Fat Tail Investment Research
Fresh Economic Thinking is reader-supported (thank you). I will also post advertisements from time to time.
Fat Tail Investment Research is an Aussie outfit that publishes research on a range of investment options. The people there have been readers of my work for many years.
Sign up for free using this link for their investment insights about stocks that historically pay a consistent income AND could deliver capital growth.

The 9th series reweighted the basket following the 1974-75 Household Expenditure Survey (HES). Using that data, the CPI expenditure weights became based on the spending patterns of capital city employee households in the lower 90% of incomes. Since the predominant use of CPI at this time was for centralised wage and salary negotiations, this made a lot of sense.
However such narrow definitions must be noted when making long-term comparisons, as the exclusion of spending by high-income households will bias the basket of goods captured in the CPI.
Two big housing changes
There are two big changes for housing in the CPI.
First, in the 11th series from 1986 onwards, the ‘home ownership subgroup’ was modified by deleting the expenditure class ‘house purchase including alterations’, and replacing it with ‘mortgage interest charges’. So instead of purchase prices only, this component was a measure of purchase prices multiplied by the prevailing mortgage interest rate.
No doubt this was to reflect the nature of housing as a durable good, with interest as a proxy for the annual portion of consumption of the home.
Second, in the 13th series in 1998, these changes were reversed and further modified. As the ABS explains:
The most noticeable changes to the item coverage were the exclusion of mortgage interest and consumer credit charges from the index and the inclusion of expenditure on new dwellings (excluding land).
This change in the treatment of housing was strongly supported by the Reserve Bank of Australia. By this time, monetary policy was influencing mortgage interest rates, so including a mortgage payment made little since—as soon as interest rates were increased by monetary policy to reduce inflation, it would directly cause inflation in the measure of mortgage repayments in the CPI.
Purchase prices as a whole wouldn’t make sense, because land was thought to be an asset and not part of the consumption bundle. Second-hand goods are excluded from the CPI in Australia, so the price of trades of existing homes aren’t in there either (nor are second-hand cars, even though second-hand cars ARE included in the United States CPI).
So in this 13th series, only the construction cost of new homes was included as a proxy for the consumer price of housing for owner-occupiers, with a weight of 6.9% of the basket.
This approach is very different to the approach in many other countries. I have noted before how the United States measures the price of owner-occupied housing using an imputed rent that is weighted at an astonishing 24% of the CPI basket!

What it means in practice is that only the cost of new dwellings excluding land makes it into the CPI, which makes the owner-occupied housing component more of a residential construction cost index.
Pure prices versus the cost of living
Possibly as significant as this change to measuring the cost of owner-occupied housing was that the purpose of the CPI changed in the 13th series from being a cost of living index primarily designed for income adjustment purposes, to a measure of inflation faced by consumers to support macroeconomic policy decision making.
To compensate for this change the ABS introduced its Living Cost Indexes (LCIs) to fill some of the information void left by the new CPI. Because the LCIs include mortgage repayments, cost inflation measured by these indexes was slightly higher than the CPI during the 2000s housing boom (when interest rates and prices were rising) and lower during the 2010s and COVID due to declining interest rates.

In keeping with the philosophy of the CPI as a pure price index, the weightings were again changed in the 14th series revision to address possible consumer substitution between commodities in response to relative price. This was to overcome the problem of substitution bias, which arguably results in an overestimate of the CPI.
Some argue that accounting for substitution bias is problematic. The following quote from John Williams notes the conceptual shortcomings of adjusting a price index to compensate for substitution to cheaper alternatives.
…when steak got too expensive, the consumer would substitute hamburger for the steak, and that the inflation measure should reflect the costs tied to buying hamburger versus steak, instead of steak versus steak. Of course, replacing hamburger for steak in the calculations would reduce the inflation rate, but it represented the rate of inflation in terms of maintaining a declining standard of living.
My personal view is that if we aren’t properly capturing quality improvements in many items, then ignoring substitution will be a problem from a pure price index perspective. This issue is far less of a concern than how to account for new types of products that never existed before, like the inclusion of motoring, telephones, computers, home entertainment, and so on. It was a good thing that the cost of horses dropped out of the index when people substituted for cars.
Quality adjustment and financial services
The 15th series began in September 2005, and in this series, hedonic quality adjustments were introduced to the computing equipment component of the index. This has had the effect of showing enormous reductions in the price of ‘constant quality’ computing but is a relatively minor part of overall CPI.
A new category of financial and insurance services was also introduced in 2005, with the main component of this new category being deposit and loan facilities, which measures
changes in the amounts payable as explicit fees and charges, and the amounts payable as interest rate margins. The changes in both these elements then need to be combined to obtain the aggregate or net change in the price of deposit and loan facilities.
This new component immediately was weighted at more than 7% of the CPI basket (though that has come down to 4.6% in the 17th series) reducing the relative importance of changes to the price of other goods and services.
This is another issue to watch out for in international CPI comparisons, as the ABS is alone in including these items in the CPI.

The 17th series of Australia’s CPI began in 2017, with most of the updates focussed on data quality, timeliness and accuracy, tapping into corporate electronic systems and sales records. For example, regarding rent measurement:
The Rents series prior to July 2022 was measured on a quarterly basis using a survey of approximately 4,000 rental properties collected directly from real estate agents.
The new dataset obtained by the ABS is updated monthly and includes approximately 480,000 rental properties that are used to produce the CPI Rents series across all capital cities.
What does all this mean?
What we measure and call inflation today is not the same we measured and called inflation in decades gone by. Measurement issues abound, and the methods have evolved with the times and our political and economic needs for a price index.
We are now much better at monitoring prices, which is excellent. However, the big historical changes and conceptual quirks need to be considered when making international comparisons.
I’m not saying the CPI is bad, or wrong. It contains extremely useful information about short to medium-term price changes. It is just that if we want to make precise comparisons historically, or internationally, we need to understand just how much the chameleon CPI has changed its colour.
The Australian Bureau of Statistics began compiling a CPI series in 1948 so the first full year of data starts in 1949.
Impressive account that emphasizes the need to be cautious. When it comes to the hot topic of housing, that the US gives a weight of 24% in the index based on an imputed rent, that seems to me to be a better way to go in gauging the costs that consumers have to meet, so a better way to monitor the impact on living standards that might be of interest to Treasury, the RBA and wage setting tribunals.
I'm looking forward to the book.
You could make the same argument for GDP or even cross-country comparisons of GDP. It is a very nuanced piece. Thank you for writing it!