
Please stop confusing supply and density in housing debates
People say they get it. But they don't.

It is nearly the end of the financial year in Australia. A paid subscription to Fresh Economic Thinking could be a tax-deductible expense for you. Please consider supporting to get access to this and all articles, the audiobook of The Great Housing Hijack, the charts page, and more.

A dominant line of thinking in policy-land is that allowing higher housing densities increases the rate at which new housing is produced.
Few people express it so precisely, but many believe it to be true. In doing so, they unwittingly conflate the two completely separate concepts of ‘density at a site’ and ‘rate of housing production across a market’ under the single label of ‘supply’.
Indeed the less aware they are of the distinction, the more cocksure they are in calling out idiots who don’t see the world as they do. After all, “it’s ECON101, stupid”.
But supply is not density.
I’m reluctant to use the word supply at all.
Supply, in its specific and technical economic meaning, is not a quantity of existing homes nor a rate of production of new homes. Supply is a concept of market exchange. Think of it as an offer curve at a market exchange—all the sellers line up with the price they would accept to trade. This is why, with the same stock of homes, you can have a market boom or a market crash depending on supply (willingness to sell in a period) and demand (willingness to buy in a period).
Saying that a price change is due to supply and demand is not an explanation but a tautology. The explanation needs to answer the question of why sellers and/or buyers changed their willingness to sell and/or buy.
As Brian Albrecht has explained, supply represents the demand from the current owners of the product being traded. While we often think that supply is independent of demand, it really isn’t. There is no such thing as an independent supply.
I’ll do my best to talk about the stock of dwellings, the growth in the stock or the rate of new housing production, and other specific terms. Though it is hard to escape the word supply and I might just use it at times to mean the rate of new housing production.
Now, back to the frustrating topic of confusing density and the rate of new housing production. You will find an abundance of examples of this in housing debates.
Here is an especially clear example from the New South Wales Productivity Commission (NSW PC). They wrote a report asking about how much lower rents would be if all new buildings were denser but with the effect of assuming that dwellings were built faster.
About 1,500 new apartment buildings were built in Sydney between 2017 and 2022. These buildings averaged seven storeys and contained ten dwellings per storey (NSW Productivity Commission, 2023a). If instead we had permitted modestly denser development—for example, if apartments had averaged ten storeys instead of seven—then an extra 45,000 homes could have been provided, all without using any extra land and with minimal effect on neighbourhood character.
The additional 45,000 units would represent a little over two per cent increase in Sydney’s private dwelling stock. Typical rules-of-thumb suggest this extra supply would have lowered apartment prices and rents by 5.5 per cent, all else being equal (Saunders & Tulip, 2019). In dollar terms, this is a saving of about $35 a week in rent on the median apartment – or $1,800 a year. For a median-income earner, this is equivalent to a 2.75 per cent increase in their real purchasing power, similar to a typical year’s wage rise.
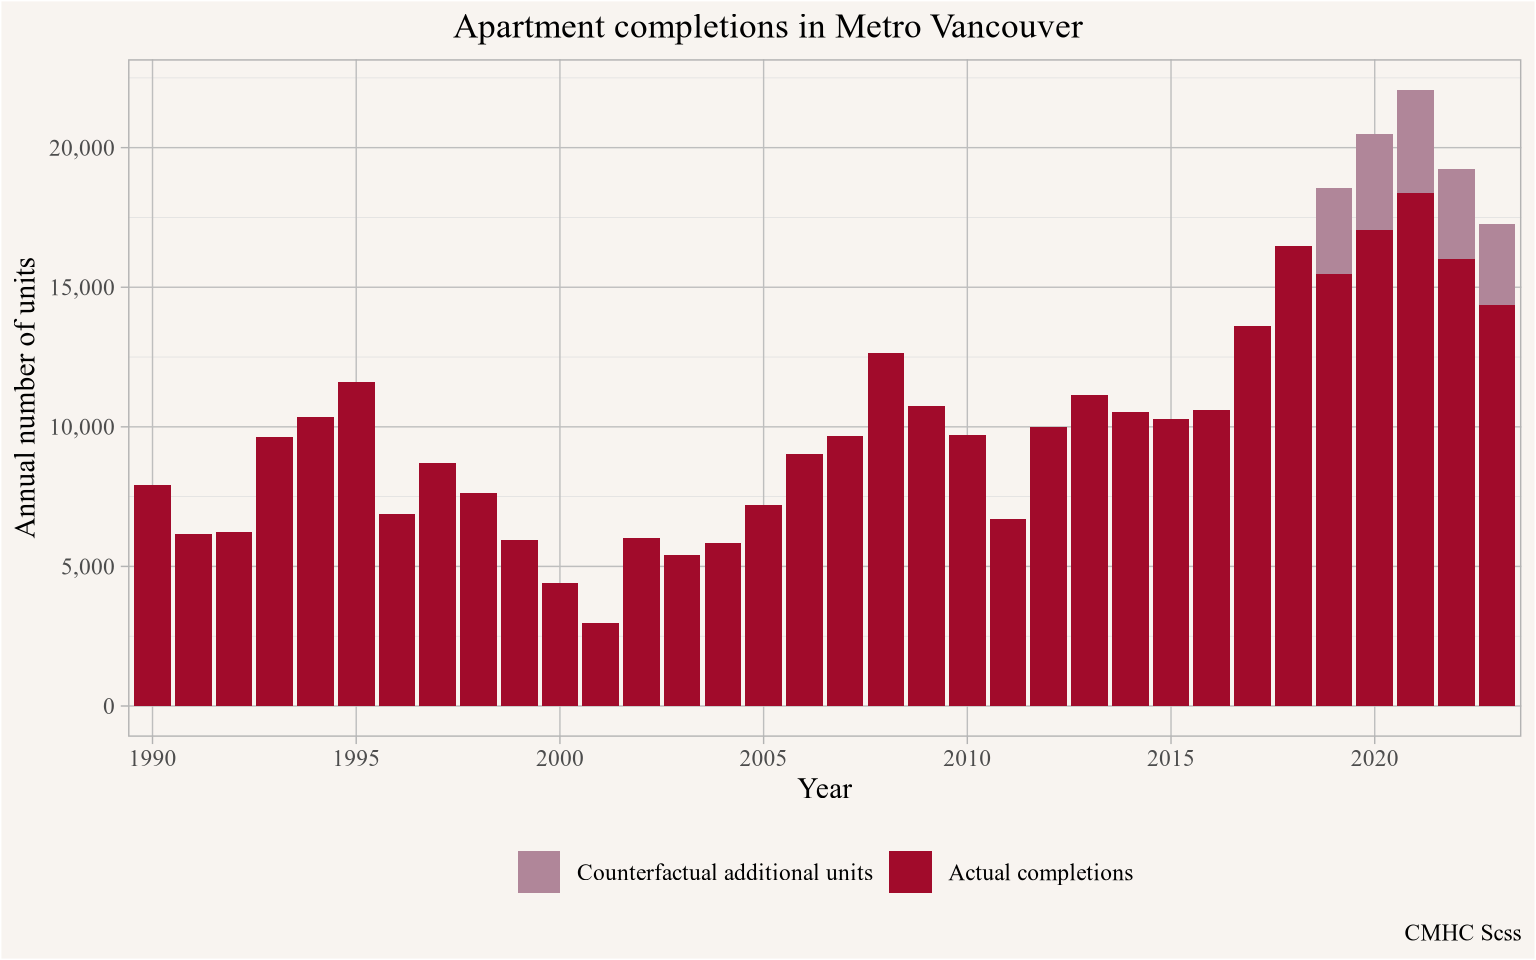
Here’s a replication of this approach for Vancouver, and you can see in this plot the counterfactual “extra” homes marked for the five years 2019-2023 due to an assumption that more density is a faster rate of new housing production.
I want to make it very clear here that density and the rate of new housing production per period are different concepts, different dimensions, with different units of measurement.
Confusing them is one of the most common problems in the analysis of housing “supply” in both academia and popular commentary.
Does this diagram help?
I am a visual learner. Maybe the below diagram of density and the rate of production on a two-axis chart will help you too.

The vertical axis is density, shown here going from 25 dwellings per hectare to 100 per hectare. The horizontal axis is the rate of new housing production, going from 4 per year to 8 per year at each density.
Notice the units of measurement are different.
Density has the unit dwellings per area (or per project given its fixed area).
The rate of new housing production has the unit dwellings per period.
Another way to think about this is that housing comes from many different projects with different densities, and the production rate of homes (supply) is the product of projects and densities, or:
Supply (dwellings/period) = Density (dwellings/project) x Projects (projects/period)
Property owners don’t choose a density to maximise their return but then choose to build so many projects as to minimise it. If the density of a particular project is limited by regulations (rather than limited by market prices) at that location, you can adjust the number of projects to meet a rate of production that overall maximises returns.
Notice that being strict about the units here resolves any confusion.1 It also shows that since the planning system doesn’t constrain the number of projects, we need to understand how that affects supply—don’t projects filter too?
The diagram also makes it clear that you can have fast low-density new housing production (bottom right corner), or slow high-density new housing production (top left corner).
Can you see why I find it problematic when I hear things like “we are getting more housing built by upzoning near train stations”? Does more mean a higher density or a faster rate of housing production?
The NSW PC made this exact conceptual mistake. They assume that the extra dwellings per land area (i.e. higher density) must be delivered within the same time period and is hence the same as a faster rate of new housing production. They simply assumed that a fixed number of sites are developed each year, and therefore if each was developed to higher density more homes would be built each year.
But the number of sites developed is a market choice. Sites are not developed as soon as it is feasible—there is undeniable empirical evidence that most sites that can feasibly be developed or sold at a profit are not (and we call this land banking). And for that matter, town planning regulations don’t limit the rate of housing production, only the density at certain locations.
Here’s what the NSW PC did.
Instead of shifting vertically to higher density but at the same rate of housing production, they effectively shifted diagonally to the right by assuming that a 20% increase in density must result in a 20% increase in the rate of supply.
But you don’t need more density for a faster rate of supply. You only need to exercise the option to develop out of the pool of feasible sites more frequently.

I hope this is clear. Please comment if it is not.
To recap, density (dwellings per land area) is not the same as the rate of new dwelling production (dwellings per period). Only increasing the second these and bringing them to market (increasing the willingness to sell) can affect the overall price level of homes under conditions of constant demand.2
But town planning rules don’t regulate the speed at which housing is developed, only the density—yet too many people who participate in housing debates cannot differentiate the two.
Paid subscribers help me share my ideas and analysis widely and elevate the quality of policy debate. Here’s a recent interview with John Brockhoff published in New Planner.
Maybe thinking about amplitude (density) and frequency (rate of production) is a useful way to help distinguish these concepts.
Again remember that the choice to build homes faster is general not independent of change to demand.
I’m later to this discussion but I was brought here by a recent Facebook post that is getting considerable engagement.
I think a lot of this conversation operates under a few assumptions that are intuitive to me but I haven’t yet had time to dig into the research on:
1. A large number of people need or want to live within a certain distance of large city centers.
2. There is a potential demand for walkable urban neighborhoods and moderate density “street car suburb” type neighborhoods that is being unmet because structural/policy factors are keeping the price of such neighborhoods too high for many people who would like to live there and/or limiting new development in and around these places.
3. Because proximity to population centers is a key factor increased density in well situated but “underdeveloped” neighborhoods is the only way to increase the supply of this type of housing.
Obviously the are many underlying cultural and personal biases underpinning these assumptions, but the basic structural critique is that certain types of desirable neighborhoods are inherently constrained by geography and transportation infrastructure and thus must become more dense if more people are going to have access to them.
If there are large amounts of unused or “banked” parcels in these existing areas a different angle could be addressing the incentives that prevent more development
You could argue that free markets should determine land use rather than paternalistic ideas of what type of neighborhood is desirable, which is a fair critique, but the current system in most places is full or government restrictions and incentives so the debate seems to be about whose vision for land use is better for cities/counties/regions in the long run.
Does allowing higher densities in result in more homes being produced, most of the time, on average, all else being equal?
As a Vancouverite, I appreciate calling out the conflation of the concepts and optimistic estimates, but we had single family zoning right around downtown for a long time and only recently are relaxing that. Seems clear that more homes in the city requires a zoning change.