
Three housing charts that will make you smarter

Don’t forget about the upcoming Land & Housing Economics Workshop I am hosting in Brisbane in June.
There is ONLY ONE WEEK LEFT to get your discounted early bird prices.
Tickets are here, and the event flyer with full details is below.

Wages are not incomes
I have previously explained that the wage price index published by the Australian Bureau of Statistics (ABS) should not be used as a proxy for personal or household incomes.
But it keeps happening.
I’m going to explain why this is inappropriate once again. I hope you all share this article when you see this error being made in future.
Households earn incomes from employment (salaries and wages), running a business (called mixed income), owning assets (shares, property, etc.) and from welfare payments.
If you want to know how much households are earning, you need to add up all of these sources of income.
The wage price index is not a good proxy for that total. It’s not even a good proxy for the wage share of that total.
That’s because the wage price index is not a measure of wage or salary income, but of the change in hourly wage for the same set of jobs in the economy. It is a price index, like the Consumer Price Index (CPI), but instead of measuring the relative price of goods and services over time, it measures relative hourly wages and salaries over time.
When the composition of jobs done in the economy changes so that there are fewer low-wage jobs and more high-wage ones, then incomes from salaries and wages will rise, even if the wage price index doesn’t.
Since people buy homes from their incomes, not from the wages for an unchanging average job, making comparisons between this index and the cost of housing is a huge conceptual error.
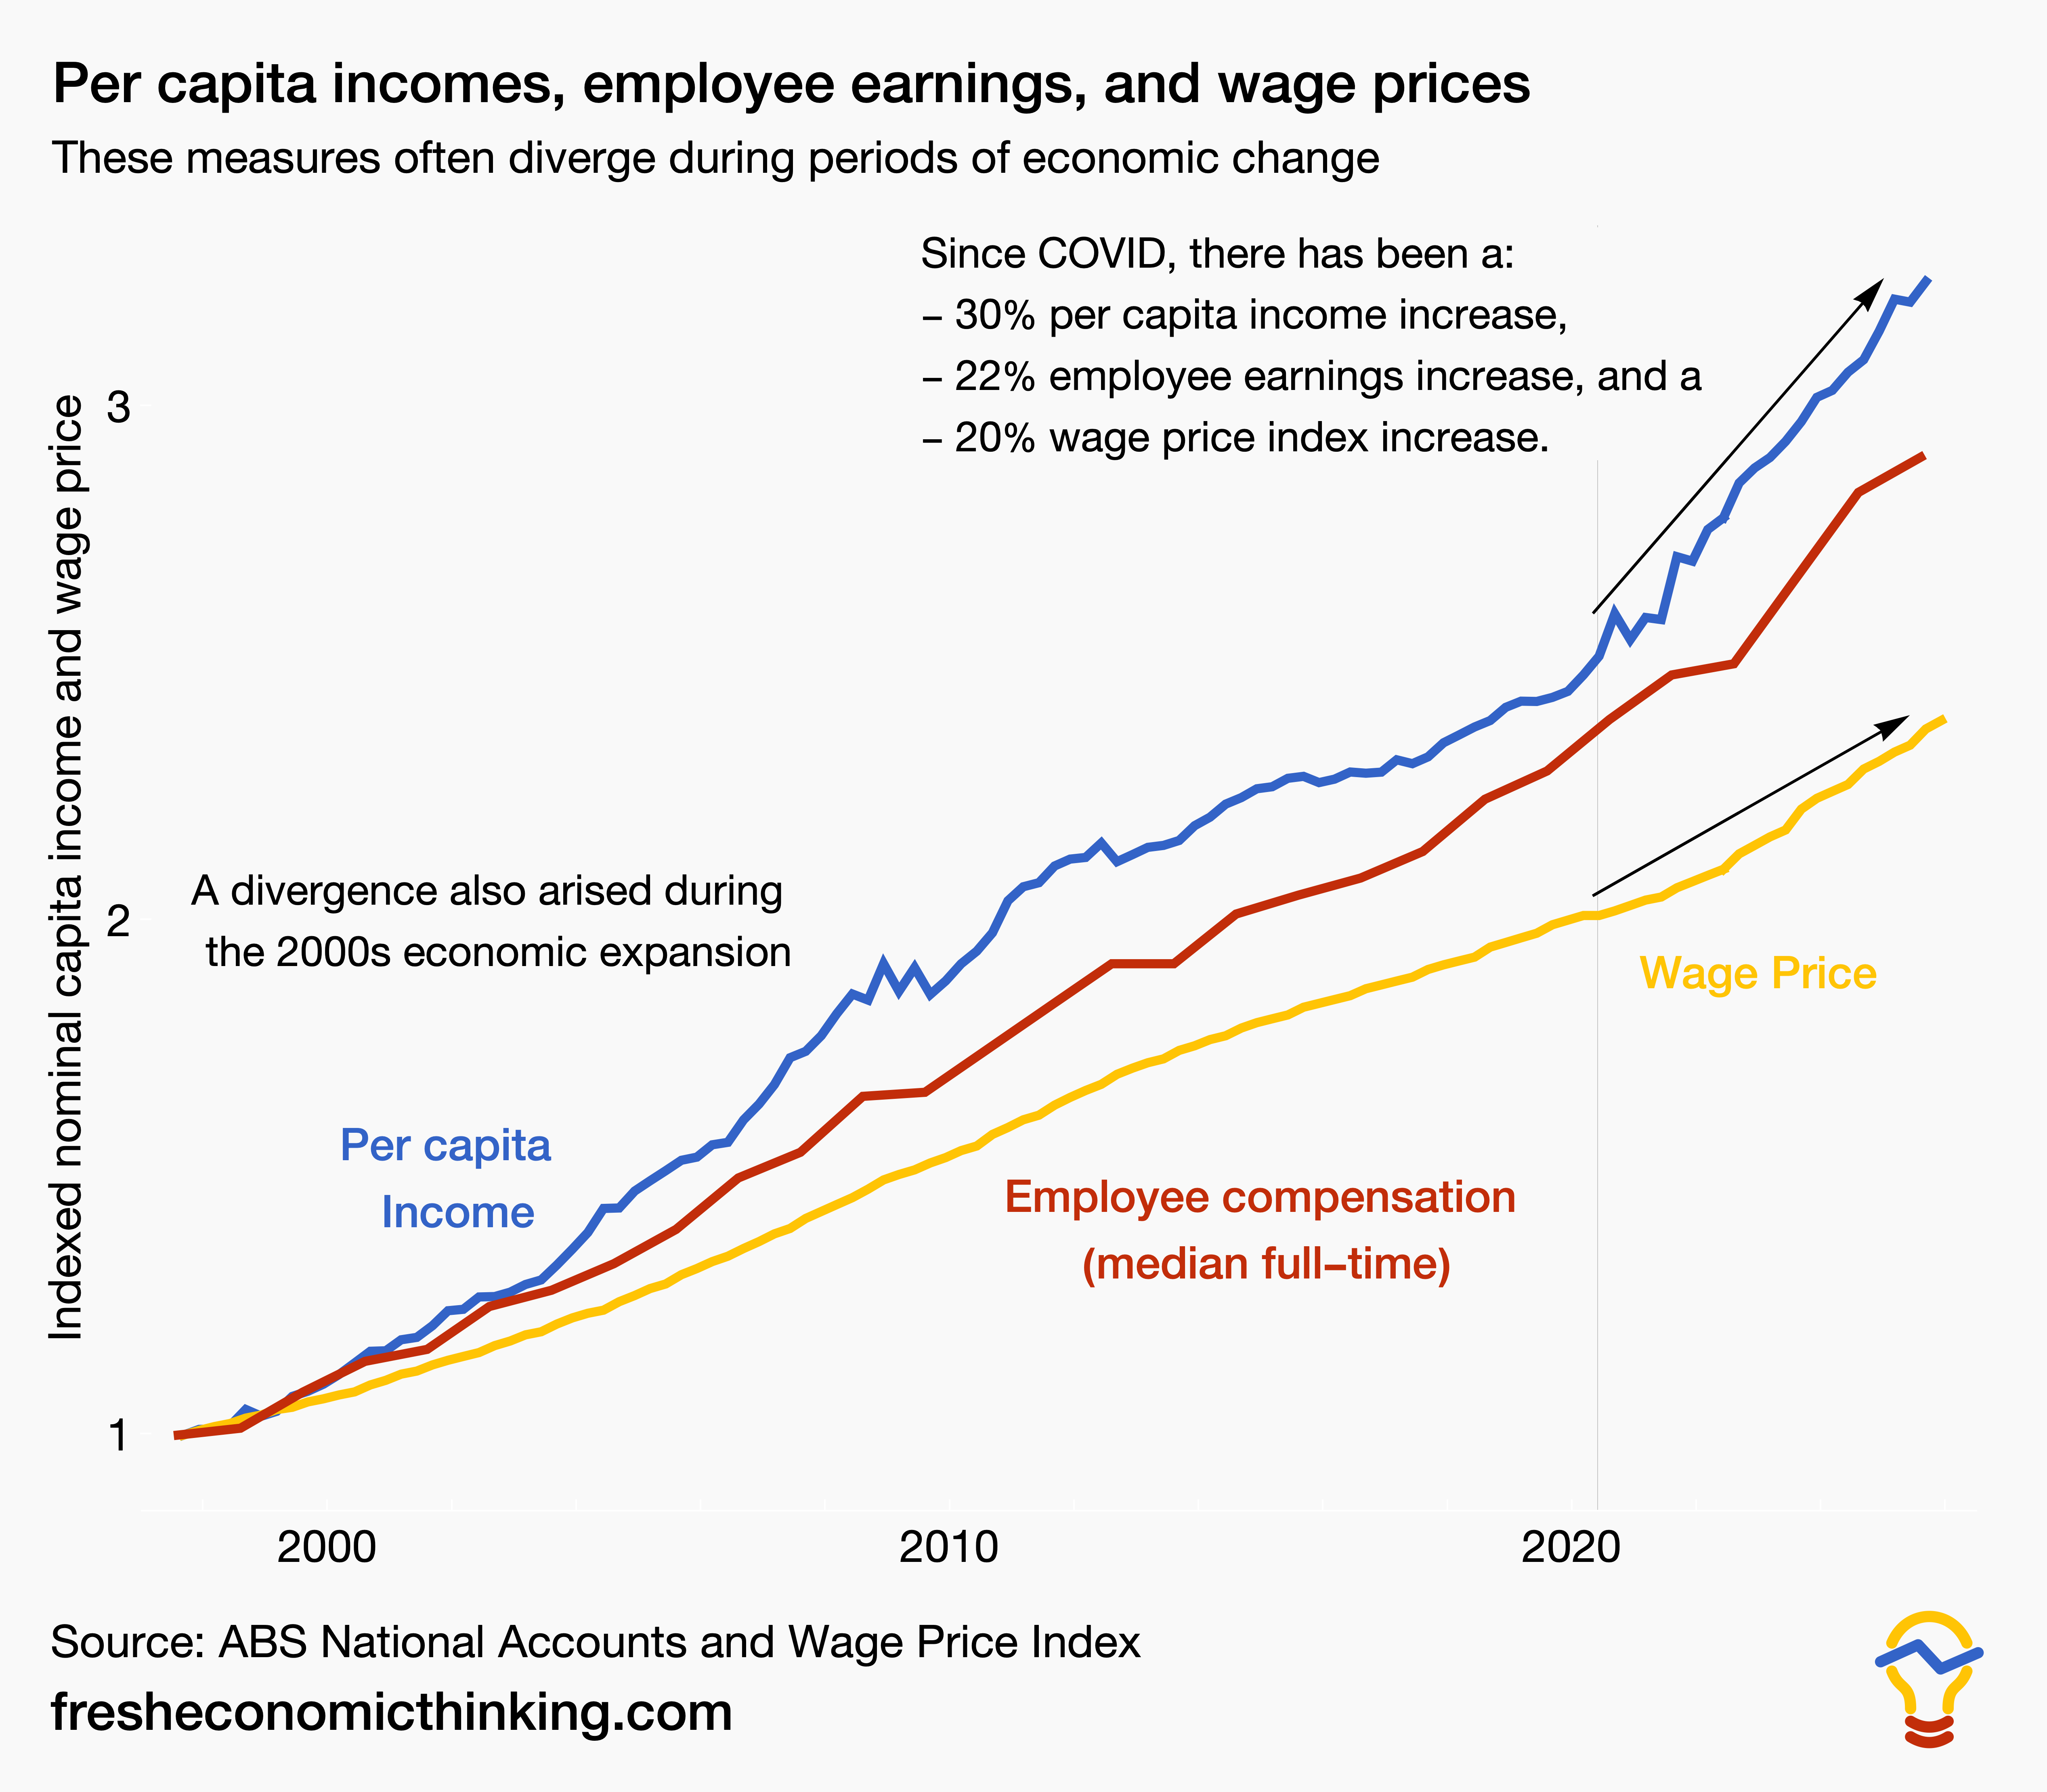
Below, I plot total per capita incomes in nominal terms from all sources (blue) against median incomes from salary and wage employment (red) and the wage price index (yellow).
Notice that per capita incomes have risen by 1.5x the wage price index over the past five years. This means the actual money households have to spend on housing and other goods has grown 50% faster than the hourly wage for the same set of job. Using the latter to assess the affordability of housing (or other goods) is wrong.
Australia’s housing turnover
One thing I find strange is that while the price of homes is set by all participants trading both new and existing homes in the market, there is a singular obsession pushing down prices by orchestrating a greater willingness to sell new homes. Little attention is paid to the willingness to sell homes from the existing stock of over 11 million homes.
Look at the chart below.
