
Speculative Index update
An update to my favourite housing market metric


Guessing which way home prices are heading next is Australia’s national pastime.
Back in 2011, I realised that a good way to understand the state of the housing market was to compare the gross rental yield of housing assets to the prevailing mortgage interest rate. That is why in early 2013 I wrote that
if you have been holding off purchasing a home because of the risk of capital losses, then these risks are probably lower now than at any time in the past decade.
In May 2016 I called the top of the market. A little early, but prices peaked the following year.

Then in May 2020, I argued the bull case for Australian housing, despite widespread agreement that COVID policy disruption would lead to unprecedented price falls.
The logic behind these calls was partly as follows.
If property yields are relatively high compared to the interest cost of a mortgage, then when you invest in the property, most of your return is coming from rent. You are not relying much on capital gains for the total return (rent + capital gain) to exceed the cost of borrowing to buy that asset.
If the yield is relatively low compared to the cost of a mortgage, then you are relying on capital gains for the return to housing to exceed the cost of borrowing.
The speculative index is what I came up with.
Speculative Index = Mortgage interest rate / Gross yield
I doubt I’m the first to divide these two numbers.
In practice, however, these two numbers aren’t that straightforward to generate at an aggregated level. Mortgage interest rates seem obvious, but do you count discounted rates, fixed rates, standard comparison rates, or weighted rates on outstanding mortgage balances?
On yields, again, we only know rents for new leases on rented housing, or advertised rents, and matching these to sales prices to generate representative yields requires many assumptions.
But I think that on the whole, we can get close enough to see the trends.
Here I borrow from the efforts of Peter Tulip and Ryan Fox who did some great analysis at the RBA to generate reasonable estimates of these numbers.
Doing this creates the chart below for the Speculative Index across the Australian market as a whole for two choices of interest rates; standard and discounted variable.

I notice some important patterns in this chart.
The index moves within a limited range, from about 1 to about 2.5. That is, mortgage interest rates never exceed 2.5 times the gross yield of housing and never fall below the yield.
If you buy housing when the Speculative Index is closer to 1 rather than 2, you usually make much more money than the reverse. So I have marked a Buy Line and Sell Line as a guide of what sort of investment strategy this metric suggests.
If the expected cash rate rises over the next year are passed on to mortgage interest rates, that pushes the index way up to its limit (dashed lines are a forecast based on that assumption). That is, mortgage rates will be about 2.5 times the gross rental yield of housing by the end of 2022.
Because the index was near its all-time-lows in 2020, I predicted that property prices were much more likely to rise than fall, even with the COVID shock. At the time, fixed interest rates were also much lower than the standard rate, though this has now reversed.
That the index moves in cycles shows that adjustments to interest rates take time. They aren’t anticipated. If markets did adjust prices quickly in response to interest rates, this index would be a flat line. Markets do adjust to interest rates. But slowly and cyclically.
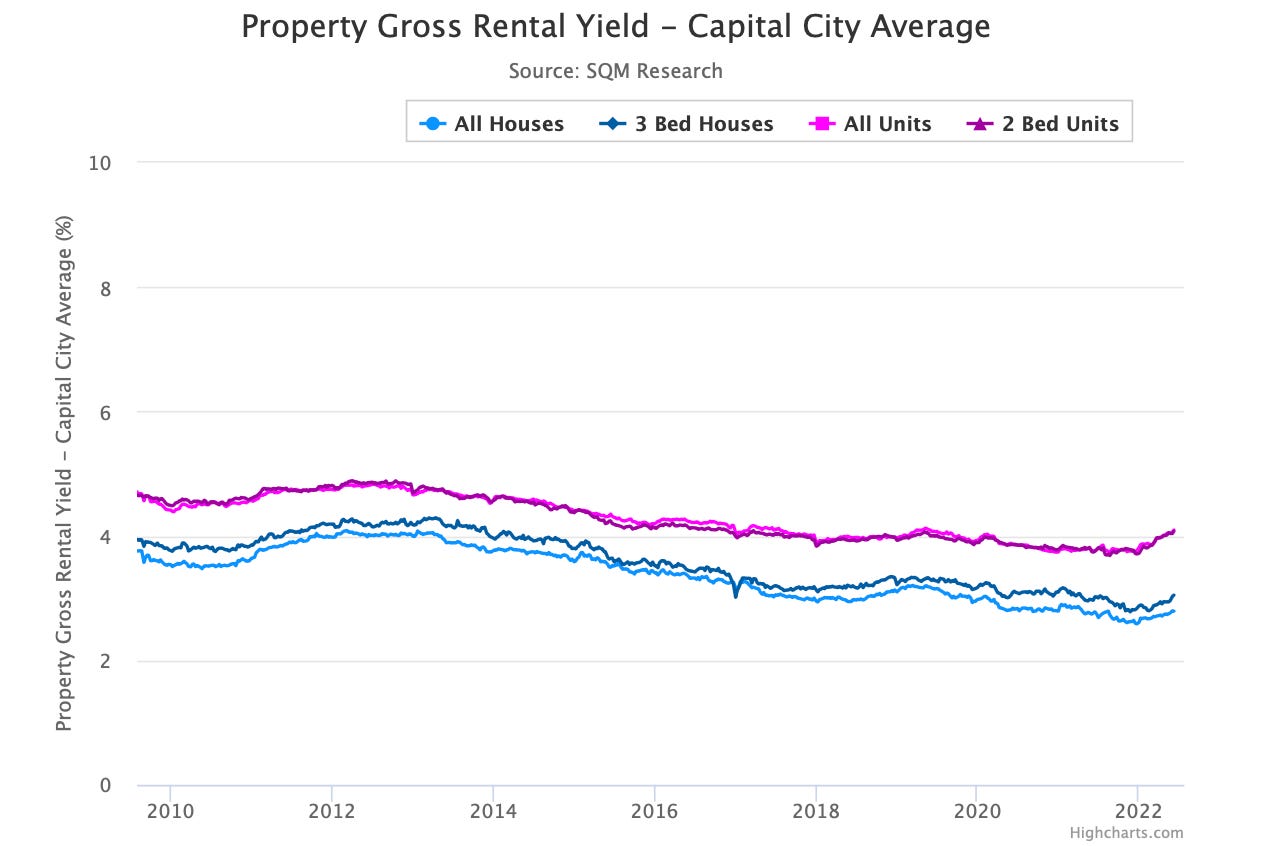
Another factor to keep in mind is that according to SQM research, gross yields are trending up nationally at the moment. This is partly driven by higher rents overall, and for the apartment market, flat prices. These effects could flatten out the expected rise in the Speculative Index in response to interest rates.
Lastly, different cities have slightly different market cycles. The above chart shows the national average. It is possible that some cities, where gross rental yields are still quite high, will boom for a while yet, like Brisbane and Perth. It is also possible that cities like Sydney and Melbourne have flat or falling prices at the same time. This happened in the 2003-06 period when Sydney prices fell 10% and didn’t recover until after the financial crisis.
What this means is that although one possibility is that house prices fall uniformly as interest rates rise, this is not the norm. One possible outcome is that prices in low-yield cities like Sydney and Melbourne fall 10-15% range, but other higher-yield cities see price rises for another year, with smaller overall falls.
If prices do start falling broadly, I’d expect an economic slowdown to follow and interest rates to be dropped once again.
Any update :)
Cameron, it would be really great if you could calculate the Speculative Index every month ( quarter ? )by capital city and post it on your site. Or do you know where I can find the data relatively easily.
I have found it very difficult or expensive to get all the data to do it myself.
Also, have you done one for NZ?