Planning system data shows plenty of approved housing in South East Queensland
But it hasn't done much for rents and prices
Very useful planning system data is compiled by Queensland state statistical agency (here). It helps show a system functioning responsively to market conditions.
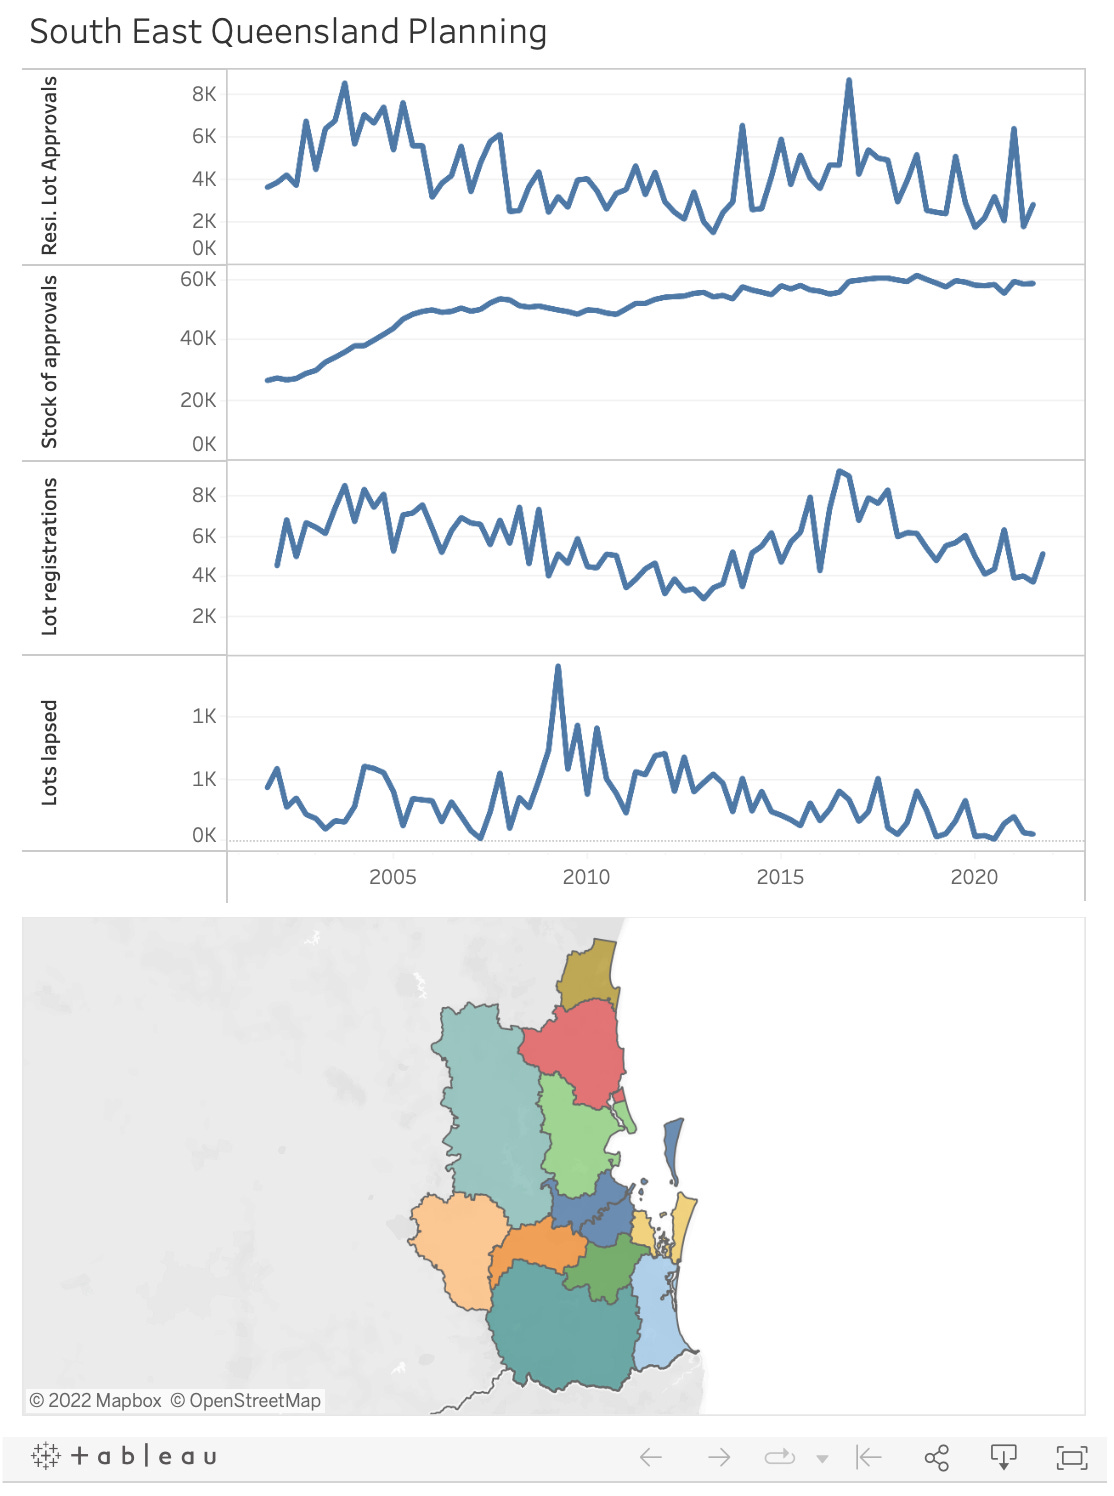
Have a look at the image below and click here to go to the interactive version.
The charts map out the operation of the planning system. New approvals flow into the stock of approvals active but not yet developed, and out of that stock flows lot registrations (attached and detached dwellings) and lot lapses, which are not developed before the approval’s six year expiry.
New approvals happen at a rate between 2,000 and 6,000 per quarter, depending on market conditions. Back in the boom of 2003 the rate was about 7,000. It fell gradually to about 2,000 per quarter by 2013 before rising again during the 2010s boom. Remember, only applications landowners choose to make can even be considered for approval in the planning process. It would be nice to also have data on these applications. However, we do know that the vast majority (85-95%) are approved even at peak times in the market cycle.
Those approvals contribute to maintaining a stock of approved but not yet developed housing lots. This stock doubled during the 2000s property boom, from 25,000 to 50,000. It has risen a touch during the 2010s but is relatively stable at that high level. Conceptually this is a buffer stock of approvals. Out of it, landowners and developers choose the rate at which they supply the market.
The stock of approvals declines due to new lot production, which varied between 3,000 and 9,000 per quarter over these two decades. This enormous variation suggests that market conditions regulate how fast new housing is developed. Why else would 8,000 per quarter be developed out of a stock of 40,000 approvals in 2003-04, but only 3,000 per quarter in 2012-13 are developed out of a stock of 55,000 approvals?
One interesting thing is the approval lapses. In 2009-10, during the period of global financial upheaval, between 500 and 1,000 approved new dwellings lapsed each quarter instead of being developed. Lapses remained quite high until the next cyclical upswing began in 2013.
If anyone can see how this data can be interpreted as a constrained planning system, please let me know.


